Fig. 10.
Download original image
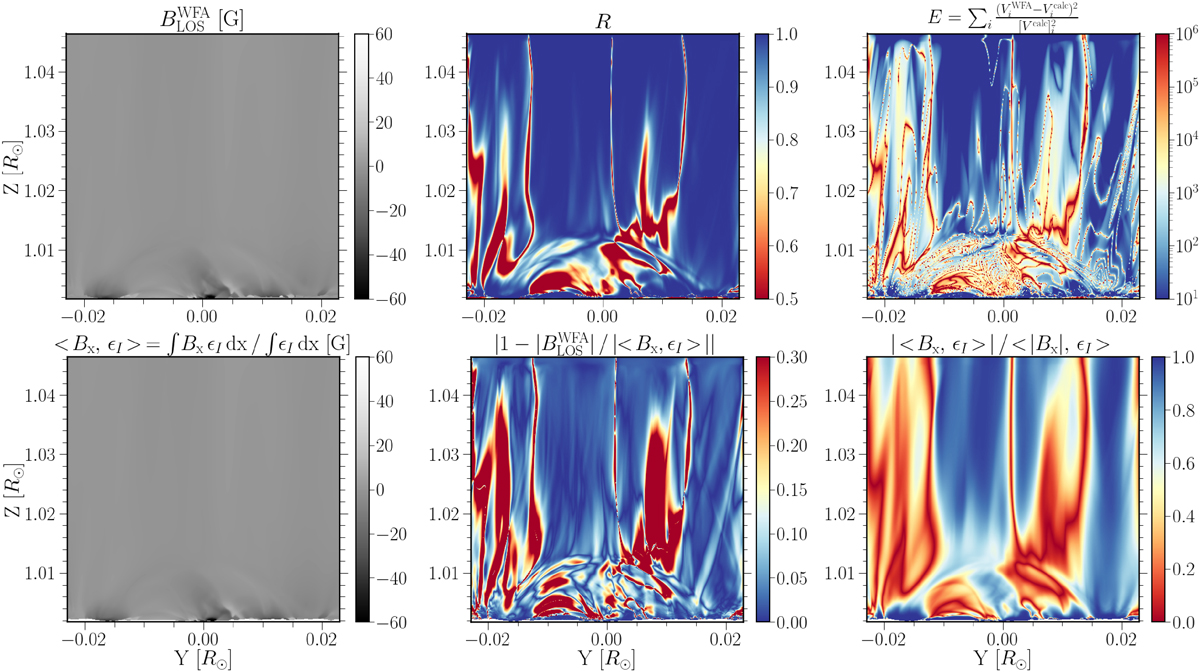
Quantities for the WFA analysis, accounting for the time evolution of the CBP. Upper and lower rows: Each panel shows the same quantities as in the corresponding columns of Figs. 6 and 7, respectively. Here the quantities are shown for Fe10747, but having integrated over the instants of the CBP model between 185 and 218.33 minutes (see text).
Current usage metrics show cumulative count of Article Views (full-text article views including HTML views, PDF and ePub downloads, according to the available data) and Abstracts Views on Vision4Press platform.
Data correspond to usage on the plateform after 2015. The current usage metrics is available 48-96 hours after online publication and is updated daily on week days.
Initial download of the metrics may take a while.