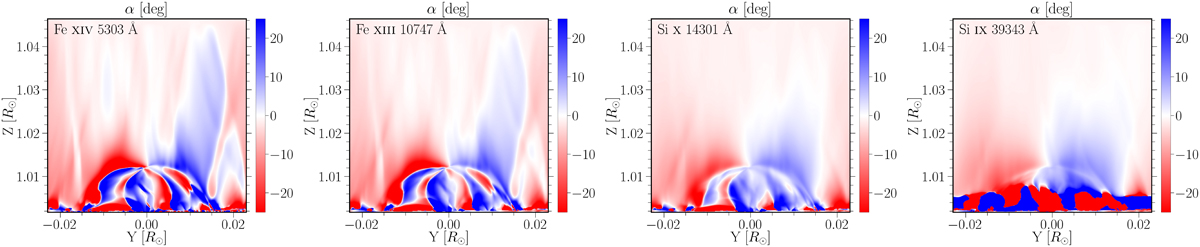
Fig. A.1.
Download original image
Linear polarization angle, with respect to the Z-axis, for the radiation emerging from the CBP. The four panels correspond to the values for Fe10747, Fe5303, Si14301, and Si39343 lines, respectively. The intensity and polarization were calculated with P-CORONA, using the CBP model at 201.7 minutes from the start of the simulation. The angles were obtained from the same calculations that yielded the results shown in Figures 2 and 3, for the corresponding spectral lines.
Current usage metrics show cumulative count of Article Views (full-text article views including HTML views, PDF and ePub downloads, according to the available data) and Abstracts Views on Vision4Press platform.
Data correspond to usage on the plateform after 2015. The current usage metrics is available 48-96 hours after online publication and is updated daily on week days.
Initial download of the metrics may take a while.