Fig. B.1.
Download original image
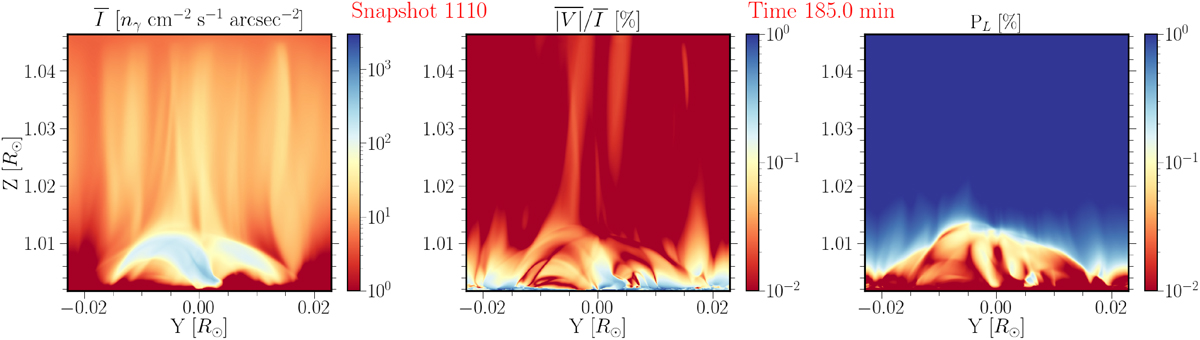
Animmation displaying the Fe10747 signals calculated with P-CORONA, as detailed in Sect. 2. The calculations were carried out using the CBP model introduced in Sect. 2.2.1, but at different instants between 183 and 218.3 minutes, in increments of ∼1.6 minutes (i.e., 100 seconds). Left panel: Wavelength-integrated intensity ![]() . Central panel: Wavelength-integrated absolute-value circular polarization, normalized to the integrated intensity,
. Central panel: Wavelength-integrated absolute-value circular polarization, normalized to the integrated intensity, ![]() . Right panel: Wavelength-integrated linear polarization fraction PL.
. Right panel: Wavelength-integrated linear polarization fraction PL.
Current usage metrics show cumulative count of Article Views (full-text article views including HTML views, PDF and ePub downloads, according to the available data) and Abstracts Views on Vision4Press platform.
Data correspond to usage on the plateform after 2015. The current usage metrics is available 48-96 hours after online publication and is updated daily on week days.
Initial download of the metrics may take a while.