Fig. 2.
Download original image
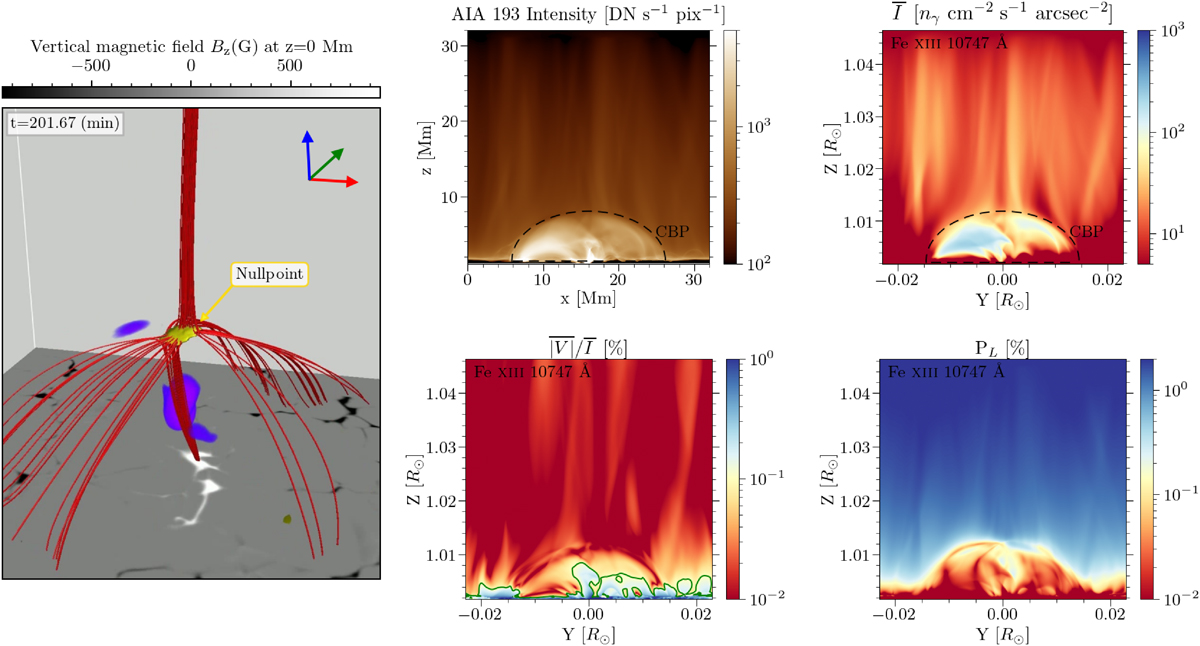
CBP model corresponding to 201.7 minutes from the start of the Bifrost simulation originally presented in Nóbrega-Siverio et al. (2023), and associated spectral synthesis calculations. Left panel: Magnetic topology of the CBP model (red lines), superimposed on a horizontal map of Bz at z = 0. The red-green-blue coordinate system of the Bifrost model indicates the x, y, z axes. Upper central panel: Synthetic intensity computed with CHIANTI (Dere et al. 2023), mimicking a limb observation by SDO/AIA 193 Å. The rest of the panels correspond to synthetic quantities of Fe10747 line, obtained with P-CORONA. Upper right panel: Wavelength-integrated intensity ![]() . Lower central panel: Wavelength-integrated absolute-value circular polarization, normalized to the integrated intensity,
. Lower central panel: Wavelength-integrated absolute-value circular polarization, normalized to the integrated intensity, ![]() . Lower right panel: Wavelength-integrated linear polarization fraction PL. The dashed black curves in the upper central and upper right panels indicate the region corresponding to the CBP. The green contour in the lower central panel delineates where the
. Lower right panel: Wavelength-integrated linear polarization fraction PL. The dashed black curves in the upper central and upper right panels indicate the region corresponding to the CBP. The green contour in the lower central panel delineates where the ![]() amplitude exceeds 0.1%.
amplitude exceeds 0.1%.
Current usage metrics show cumulative count of Article Views (full-text article views including HTML views, PDF and ePub downloads, according to the available data) and Abstracts Views on Vision4Press platform.
Data correspond to usage on the plateform after 2015. The current usage metrics is available 48-96 hours after online publication and is updated daily on week days.
Initial download of the metrics may take a while.