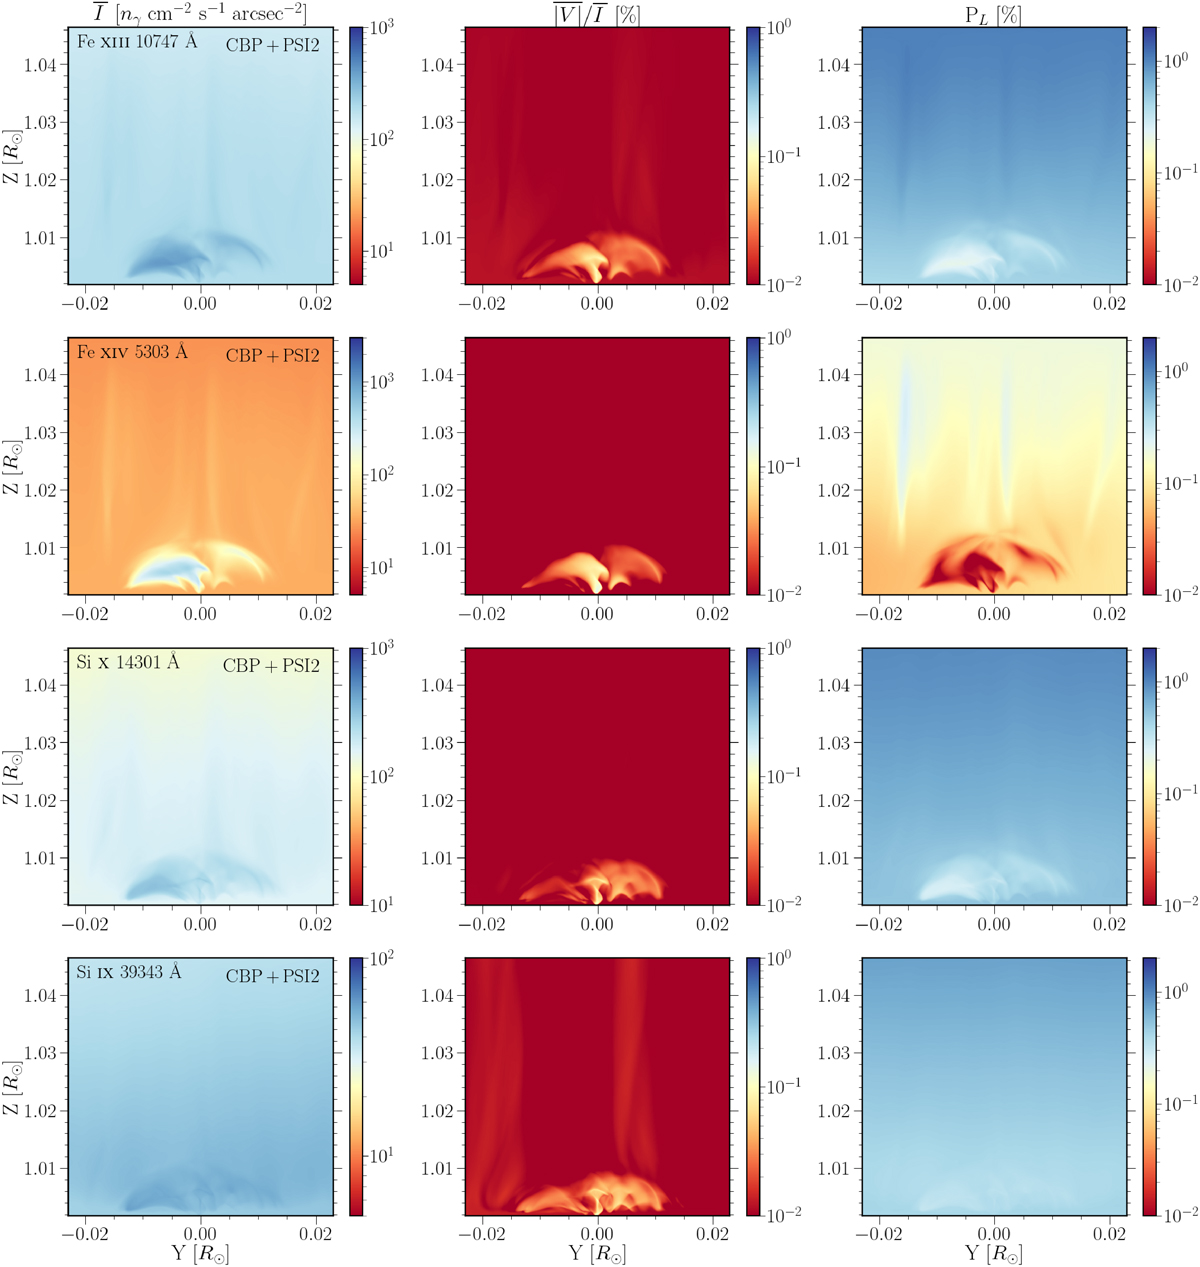
Fig. 5.
Download original image
Synthetic signals obtained by P-CORONA, for the radiation emitted by both the CBP and model PSI2 (see text), representative of the surrounding coronal material along the line of sight. Left, central, and right columns show the quantities ![]() ,
, ![]() , and PL, respectively. From top to bottom, the rows correspond to the quantities obtained from the synthesis for the Fe10747, Fe5303, Si14301, and Si39343 lines, respectively.
, and PL, respectively. From top to bottom, the rows correspond to the quantities obtained from the synthesis for the Fe10747, Fe5303, Si14301, and Si39343 lines, respectively.
Current usage metrics show cumulative count of Article Views (full-text article views including HTML views, PDF and ePub downloads, according to the available data) and Abstracts Views on Vision4Press platform.
Data correspond to usage on the plateform after 2015. The current usage metrics is available 48-96 hours after online publication and is updated daily on week days.
Initial download of the metrics may take a while.