Fig. 6.
Download original image
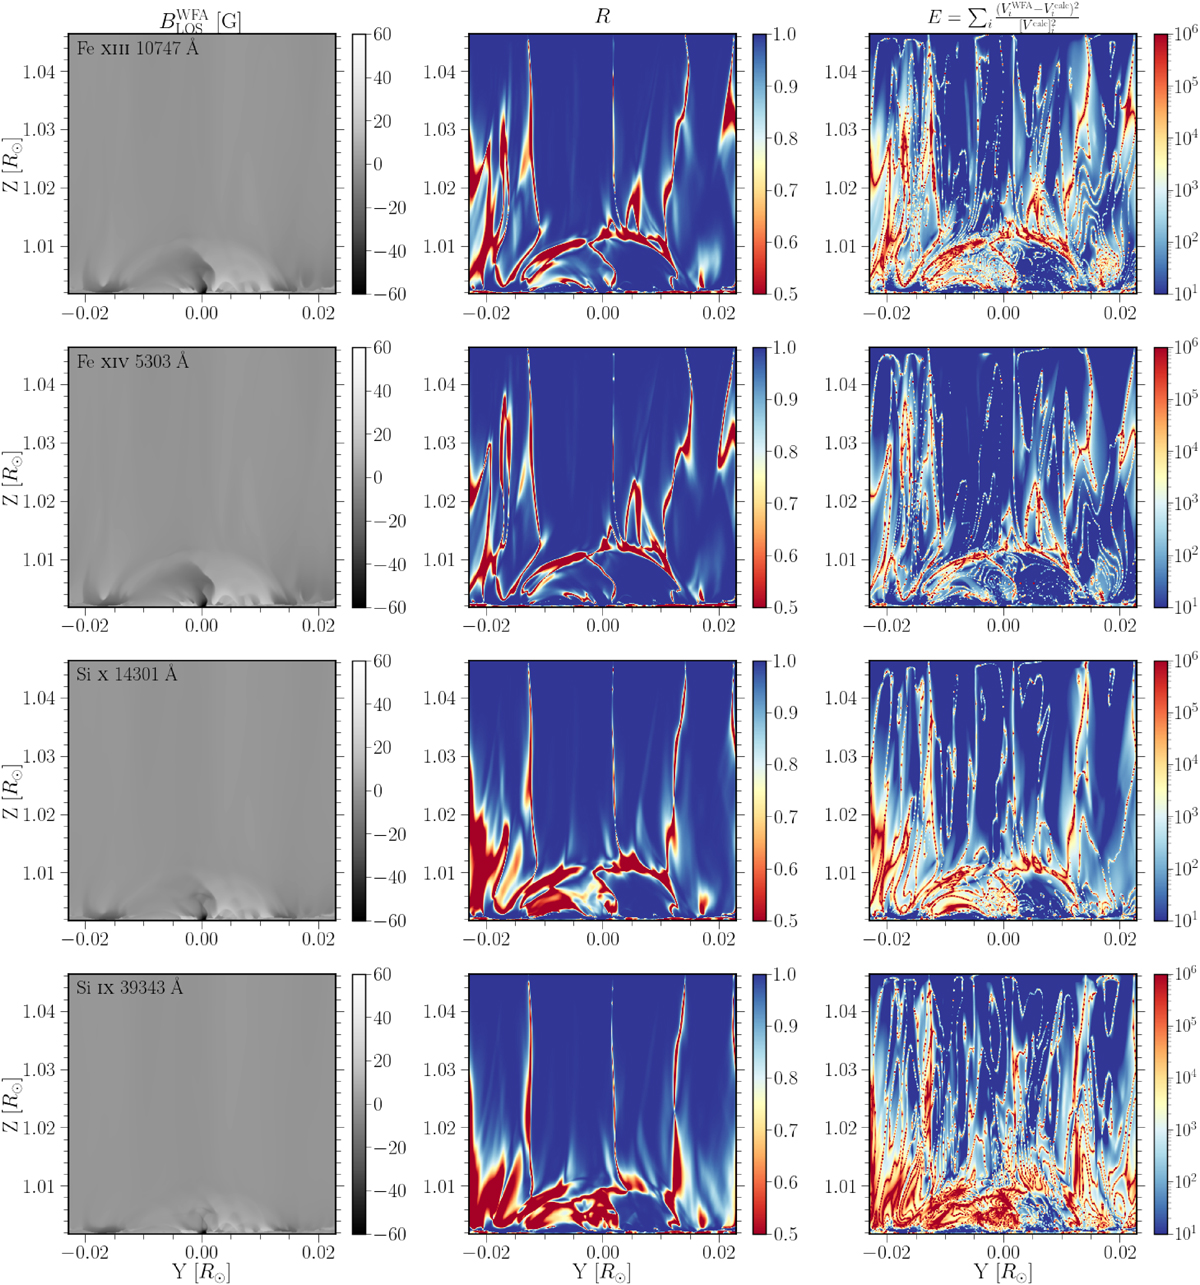
Quantities resulting from application of the WFA. From top to bottom, the four rows show the quantities for the Fe10747, Fe5303, Si14301, and Si39343 lines. Left column: Line-of-sight magnetic fields, inferred through the application of the WFA to the synthetic profiles obtained from P-CORONA (see text). Central column: Pearson coefficient for the correlation between the V(λ) and ∂I(λ)/∂λ synthetic profiles, at each point on the PoS. Right column: Square relative error between the V(λ) profiles resulting from the synthesis and from the application of the WFA.
Current usage metrics show cumulative count of Article Views (full-text article views including HTML views, PDF and ePub downloads, according to the available data) and Abstracts Views on Vision4Press platform.
Data correspond to usage on the plateform after 2015. The current usage metrics is available 48-96 hours after online publication and is updated daily on week days.
Initial download of the metrics may take a while.