Open Access
Fig. 10
Download original image
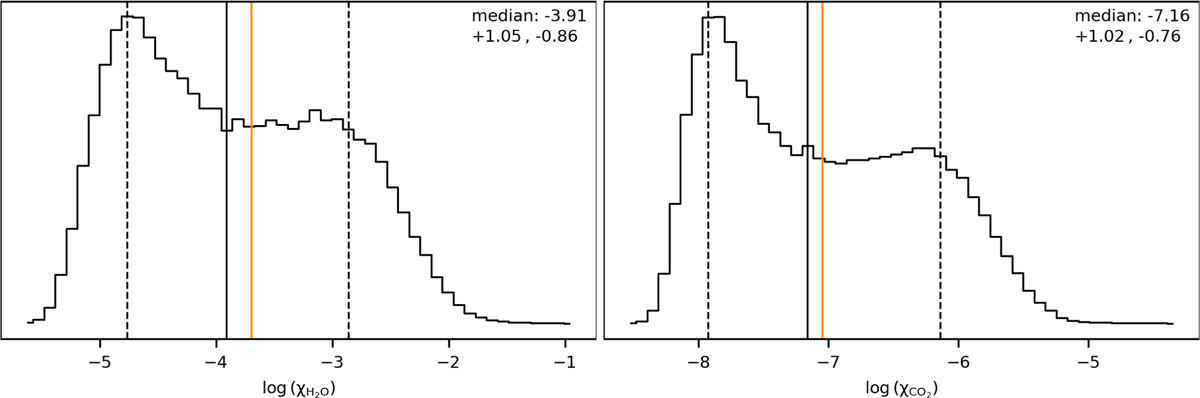
Bayesian model averaged posterior distributions for H2O (left) and CO2 (right). The black line indicates the median of the distributions, and the dashed lines are the ±34.1% confidence regions. The orange lines show the solar value of log(χH2O) = −3.70 and log(χCO2) = −7.05 at 1 mbar and 1200 K.
Current usage metrics show cumulative count of Article Views (full-text article views including HTML views, PDF and ePub downloads, according to the available data) and Abstracts Views on Vision4Press platform.
Data correspond to usage on the plateform after 2015. The current usage metrics is available 48-96 hours after online publication and is updated daily on week days.
Initial download of the metrics may take a while.