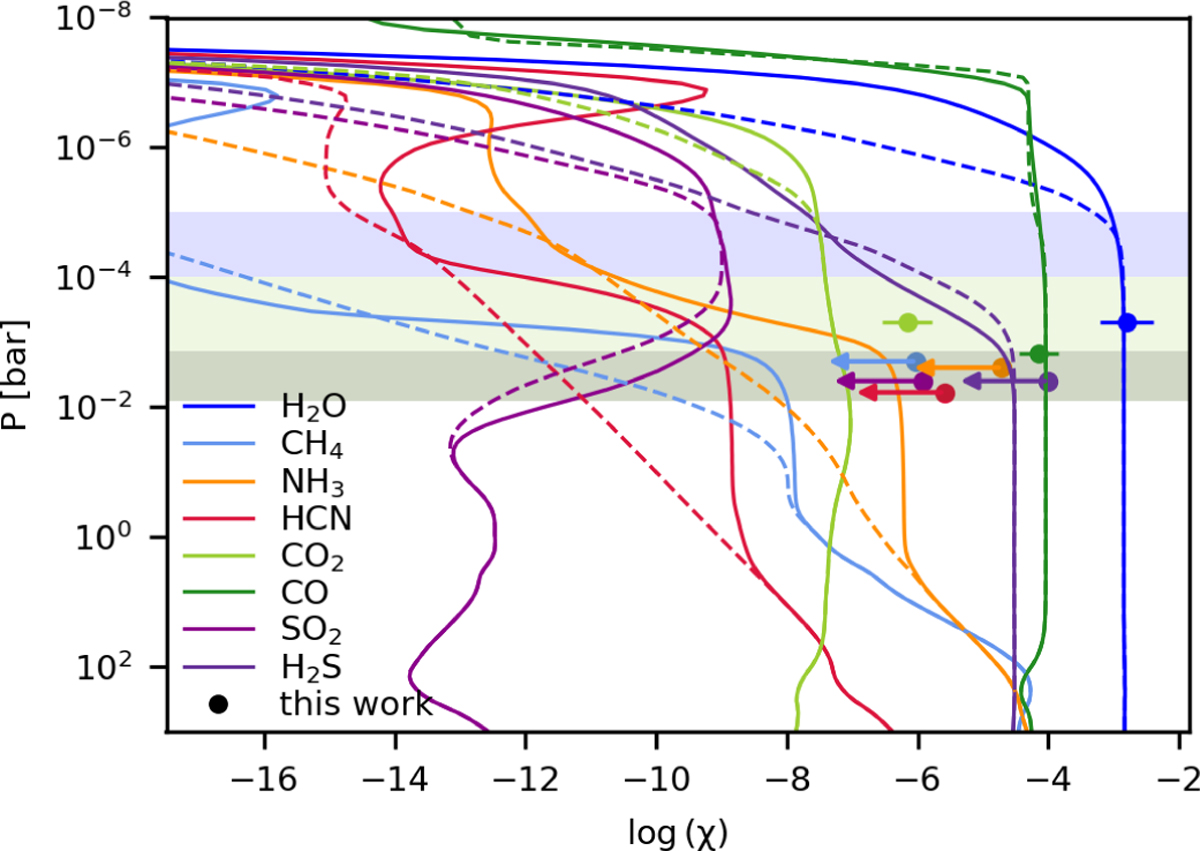
Fig. 13
Download original image
Comparison of the cloudy+CO prior retrieval results with the VULCAN 1D photochemical kinetics model by Tsai et al. (2021) (solid lines) and thermochemical equilibrium abundances (dashed lines). The dots represent the volume mixing ratios from our retrievals (with error bars for H2O, CO2, and CO; upper limits for CH4, NH3, HCN, SO2, and H2S). The shaded regions represent the atmospheric pressure levels at which the absorption is most active for the species, starting at the cloud level at 1.44 mbar (see Fig. 11 and Table 6). For CO2 (light green) and H2O (light blue), the absorption pressure level reaches higher up in the atmosphere. The Bayesian model averaged results are similar, except for H2O, which is smaller than the VULCAN 1D results, and the CO2 abundance, which agrees with the model prediction.
Current usage metrics show cumulative count of Article Views (full-text article views including HTML views, PDF and ePub downloads, according to the available data) and Abstracts Views on Vision4Press platform.
Data correspond to usage on the plateform after 2015. The current usage metrics is available 48-96 hours after online publication and is updated daily on week days.
Initial download of the metrics may take a while.