Fig. 4
Download original image
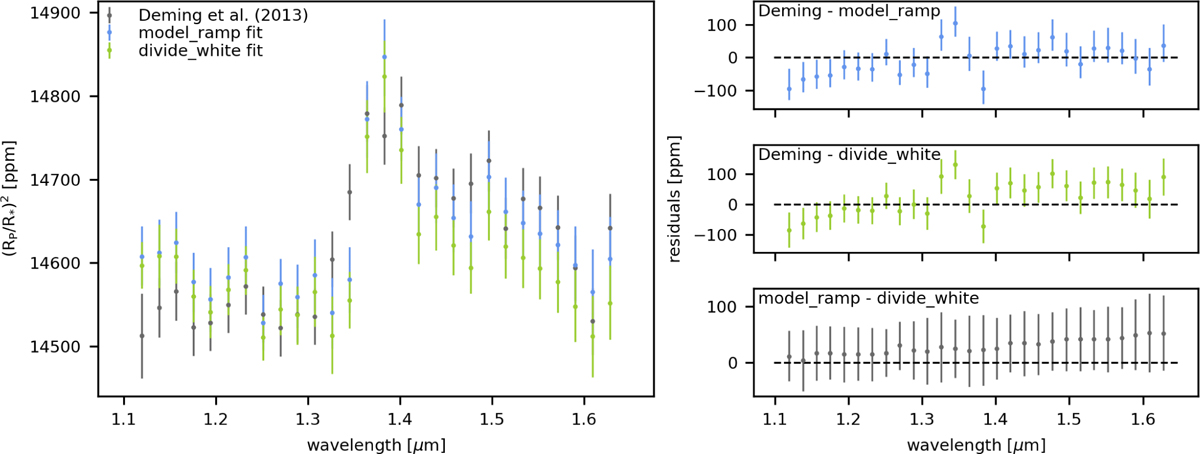
Comparison of HST/WFC3 transmission spectra for three different data reduction and fitting methods for HD 209458 b. The blue spectrum uses exponential functions to fit the systematics at the beginning of each orbit (model_ramp fit), whereas the green spectrum assumes wavelength independent systematics (divide_white fit). The grey spectrum is the original transmission spectrum published by Deming et al. (2013). The right panels show the differences between all three spectra. Noticeable is the linear trend with wavelength in the residuals for all three cases.
Current usage metrics show cumulative count of Article Views (full-text article views including HTML views, PDF and ePub downloads, according to the available data) and Abstracts Views on Vision4Press platform.
Data correspond to usage on the plateform after 2015. The current usage metrics is available 48-96 hours after online publication and is updated daily on week days.
Initial download of the metrics may take a while.