Fig. 7
Download original image
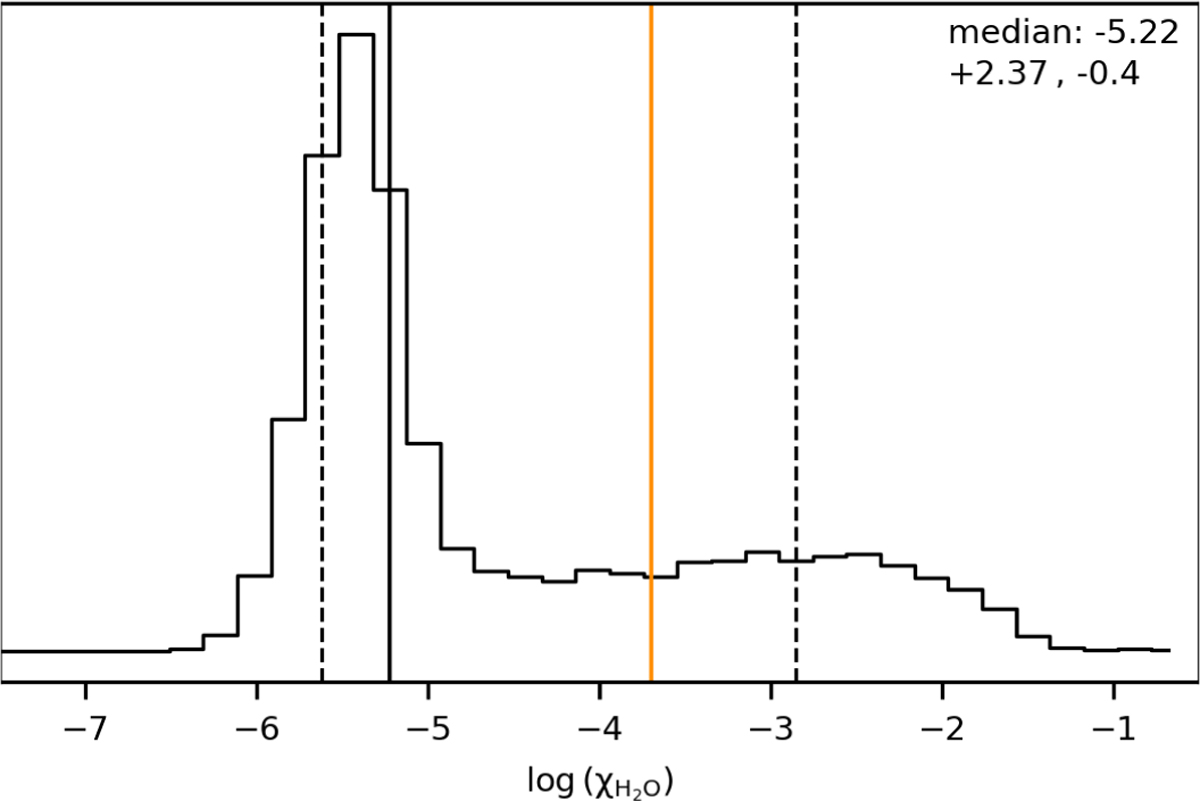
Bayesian model averaged posterior distribution for H2O from the HST/WFC3 retrievals. The black line indicates the median of the distribution, and the dashed lines are the ±34.1% confidence regions. The orange lines shows the solar value (log(χH2O) = −3.70) at 1 mbar and 1200 K. Since most of the models used for the BMA do not include clouds, the results are more heavily weighted towards the cloud-free solution, and therefore lower H2O abundances (see text).
Current usage metrics show cumulative count of Article Views (full-text article views including HTML views, PDF and ePub downloads, according to the available data) and Abstracts Views on Vision4Press platform.
Data correspond to usage on the plateform after 2015. The current usage metrics is available 48-96 hours after online publication and is updated daily on week days.
Initial download of the metrics may take a while.