Fig. 2
Download original image
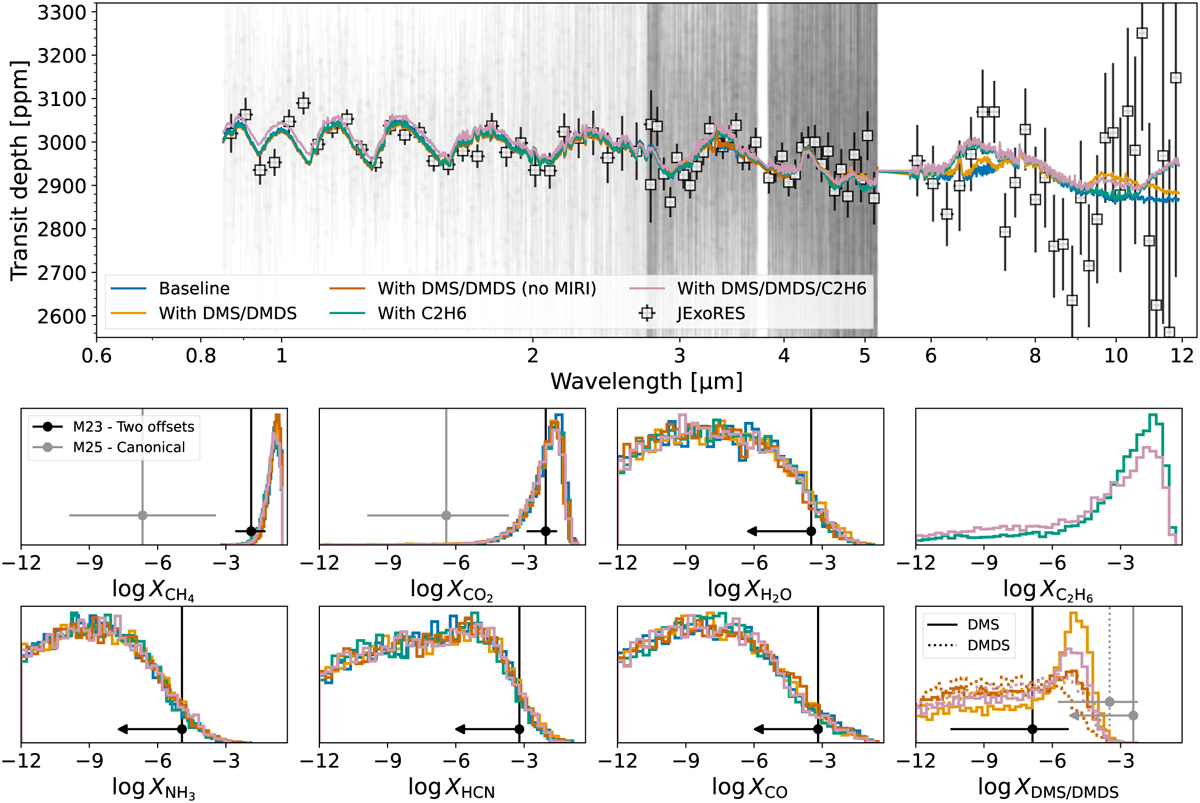
Results from PLATON retrievals performed on transmission spectrum of K2-18 b produced with JExoRES in M23 and M25. Top: transmission spectrum (native-resolution data used in the retrievals in gray; binned data in black for visualization purposes). Best-fit models for the five cases outlined in the text are shown: a baseline model (blue), a model with DMS and DMDS (orange), a model with a common hydrocarbon C2H6 (green), a model with DMS and DMDS but without using the MIRI data (red), and the baseline model with DMS, DMDS, and C2H6 (pink). Models are smoothed to R ∼ 200 for clarity. Bottom: 1D marginalized posterior distributions on molecular species included in each retrieval. Colors reflect the model in the top panel. The black points and vertical dashed lines indicate the abundances reported for each molecule in M23 from just NIRISS and NIRSpec, whereas the gray points in the DMS-DMDS panel indicate the abundances reported in M25 from MIRI data alone.
Current usage metrics show cumulative count of Article Views (full-text article views including HTML views, PDF and ePub downloads, according to the available data) and Abstracts Views on Vision4Press platform.
Data correspond to usage on the plateform after 2015. The current usage metrics is available 48-96 hours after online publication and is updated daily on week days.
Initial download of the metrics may take a while.