Fig. 2
Download original image
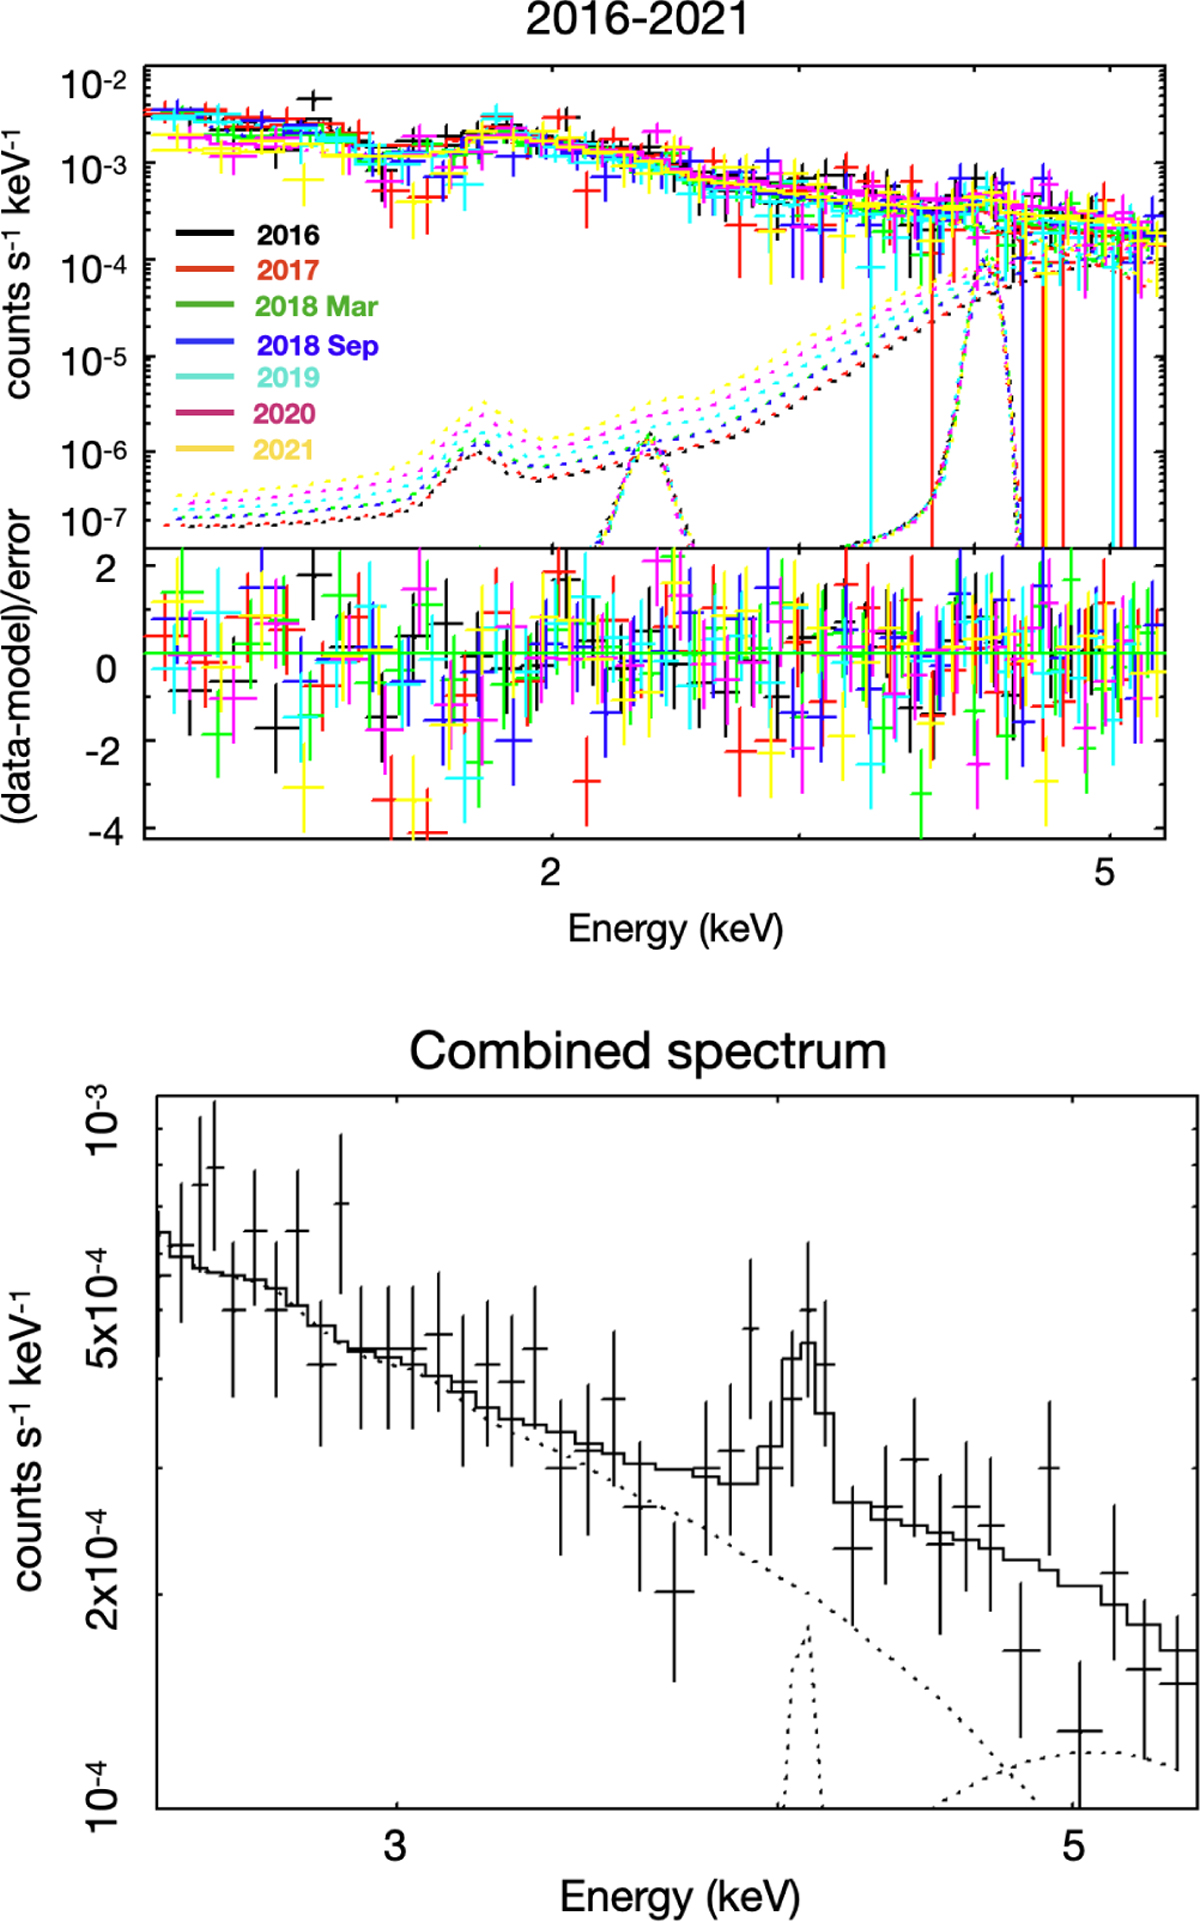
Upper panel: Chandra/ACIS spectra extracted from the circular region shown in Fig. 1 for all observations performed between 2016 and 2021 (see Table A.1), with the corresponding best-fit model and residuals. Dotted lines show each component of the best fit model for each epochs. Lower panel: combined spectrum obtained by summing all the observations shown in the upper panel. The 44Sc line is modelled by a narrow Gaussian at 4.076 keV. Dotted lines indicate the different components of the best-fit model.
Current usage metrics show cumulative count of Article Views (full-text article views including HTML views, PDF and ePub downloads, according to the available data) and Abstracts Views on Vision4Press platform.
Data correspond to usage on the plateform after 2015. The current usage metrics is available 48-96 hours after online publication and is updated daily on week days.
Initial download of the metrics may take a while.