Open Access
Fig. B.1
Download original image
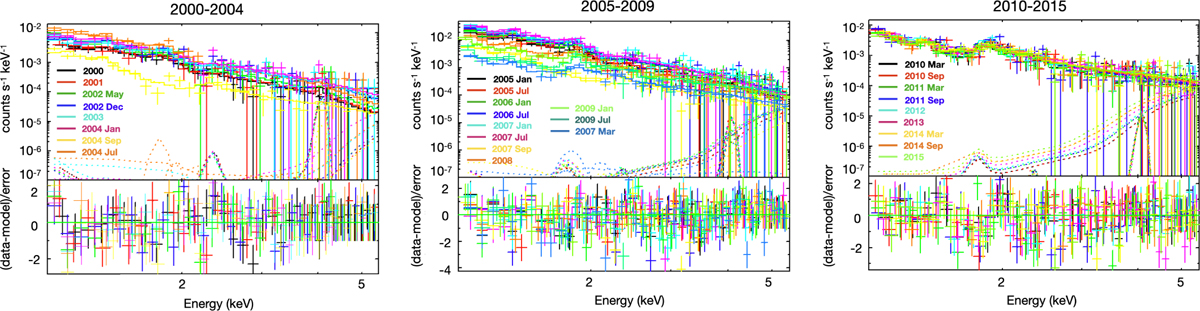
Chandra/ACIS spectra extracted from the circular region shown in Fig. 1 for all observations performed between 2000 and 2004 (left), 2005-2009 (center), and 2010-2015 (right) with the corresponding best-fit model and residuals.
Current usage metrics show cumulative count of Article Views (full-text article views including HTML views, PDF and ePub downloads, according to the available data) and Abstracts Views on Vision4Press platform.
Data correspond to usage on the plateform after 2015. The current usage metrics is available 48-96 hours after online publication and is updated daily on week days.
Initial download of the metrics may take a while.