Fig. 1.
Download original image
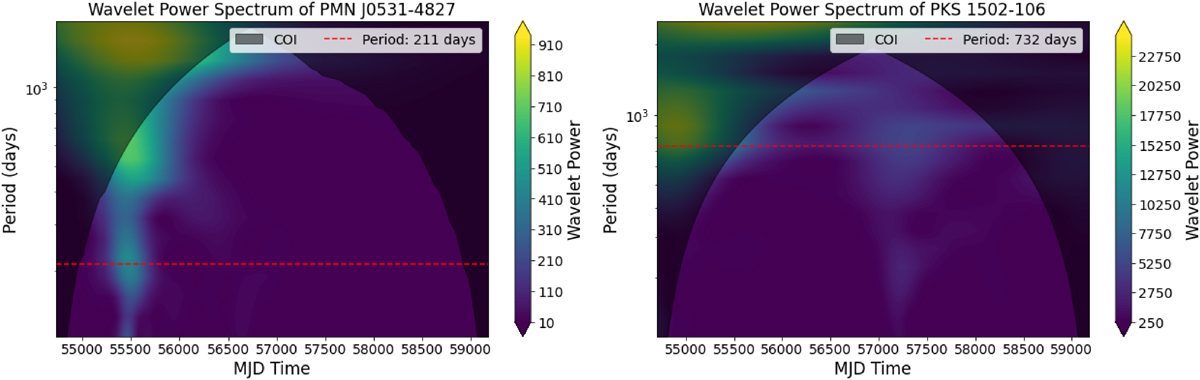
Wavelet spectra of the complete γ-ray LCs of PMN J0531−4827 (left) and PKS 1502+106 (right). The color map represents the signal’s power spectrum, with color intensity indicating the strength of QPO components at different timescales. Yellow represents a higher power, suggesting stronger QPO signals, while purple corresponds to weaker or insignificant variations. This visualization identifies patterns and scales of variability and highlights any QPO presence. The shaded area marks regions where potential modulations are too close to either the sampling interval or the signal’s total duration, reducing reliability, known as the cone of influence (COI). The red horizontal line indicates evidence of transient QPOs. For PMN J0531−4827, a potential transient QPO appears around MJD 55500, with a similar occurrence noted for PKS 1502+106.
Current usage metrics show cumulative count of Article Views (full-text article views including HTML views, PDF and ePub downloads, according to the available data) and Abstracts Views on Vision4Press platform.
Data correspond to usage on the plateform after 2015. The current usage metrics is available 48-96 hours after online publication and is updated daily on week days.
Initial download of the metrics may take a while.