Open Access
Fig. A.2.
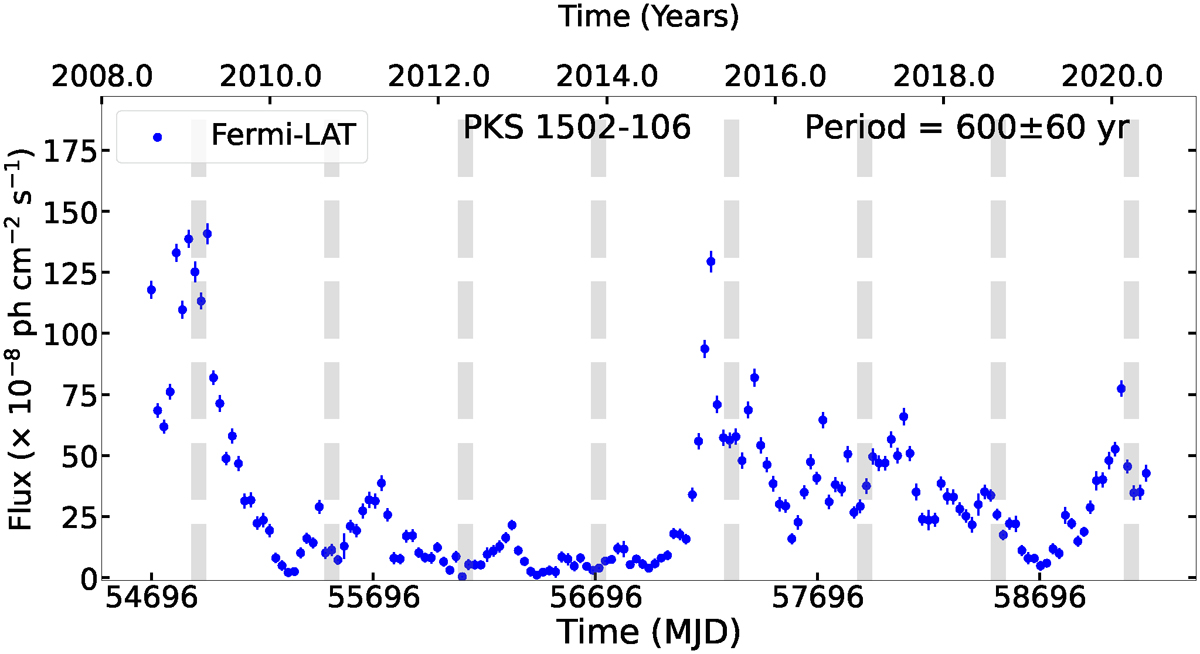
Download original image
γ-ray LC of PKS 1502+106. The gray vertical bars are used to approximate the high-flux periods, based on a period of ≈600 days, which are suggested by our analysis. The width of these gray bars represents the uncertainty associated with the periodic signal, which is an approximation of the results included in Table 1.
Current usage metrics show cumulative count of Article Views (full-text article views including HTML views, PDF and ePub downloads, according to the available data) and Abstracts Views on Vision4Press platform.
Data correspond to usage on the plateform after 2015. The current usage metrics is available 48-96 hours after online publication and is updated daily on week days.
Initial download of the metrics may take a while.