Fig. 3.
Download original image
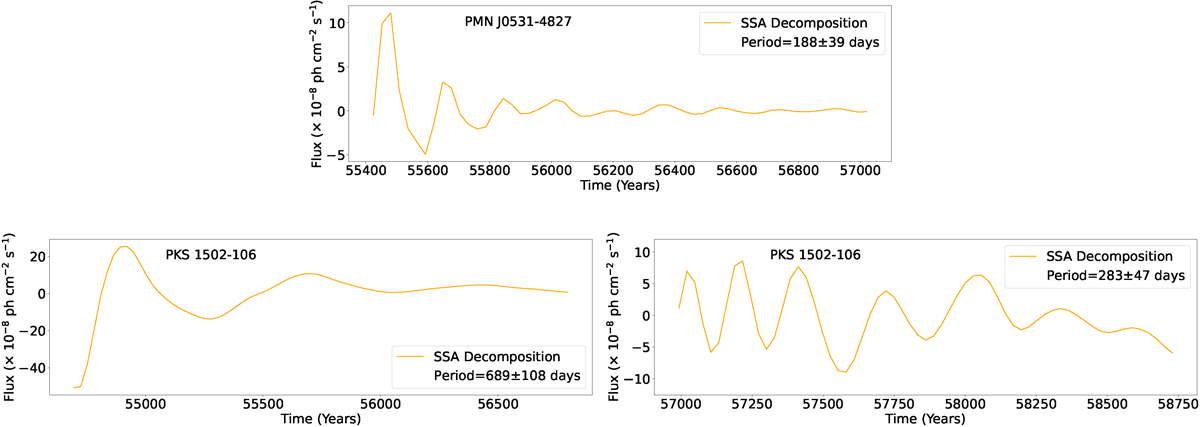
SSA decomposition of LCs of the blazars PMN J0531−4827 (top) and PKS 1502+106 (bottom), revealing the oscillatory component in the signal. The bottom panels show the decomposition of the two analyzed segments of the LC. The oscillatory patterns extracted from the LCs highlight a periodic component, with the inferred periods and uncertainties. The SSA decomposition follows the steps detailed in Rico et al. (2025).
Current usage metrics show cumulative count of Article Views (full-text article views including HTML views, PDF and ePub downloads, according to the available data) and Abstracts Views on Vision4Press platform.
Data correspond to usage on the plateform after 2015. The current usage metrics is available 48-96 hours after online publication and is updated daily on week days.
Initial download of the metrics may take a while.