Fig. 6.
Download original image
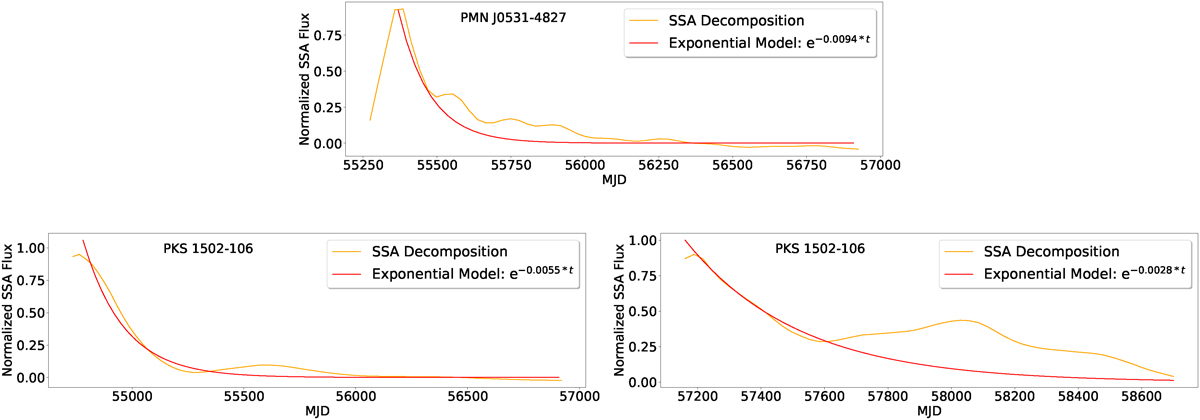
SSA LC decomposition of the studied blazars, revealing the exponential decay component in the signal. Top: PMN J0531−4827. Bottom left: First segment of PKS 1502+106. Bottom right: Second segment of PKS 1502+106. The initial value of the exponential index is indicated for each blazar. The SSA decomposing follows the steps detailed in Rico et al. (2025).
Current usage metrics show cumulative count of Article Views (full-text article views including HTML views, PDF and ePub downloads, according to the available data) and Abstracts Views on Vision4Press platform.
Data correspond to usage on the plateform after 2015. The current usage metrics is available 48-96 hours after online publication and is updated daily on week days.
Initial download of the metrics may take a while.