Fig. 10
Download original image
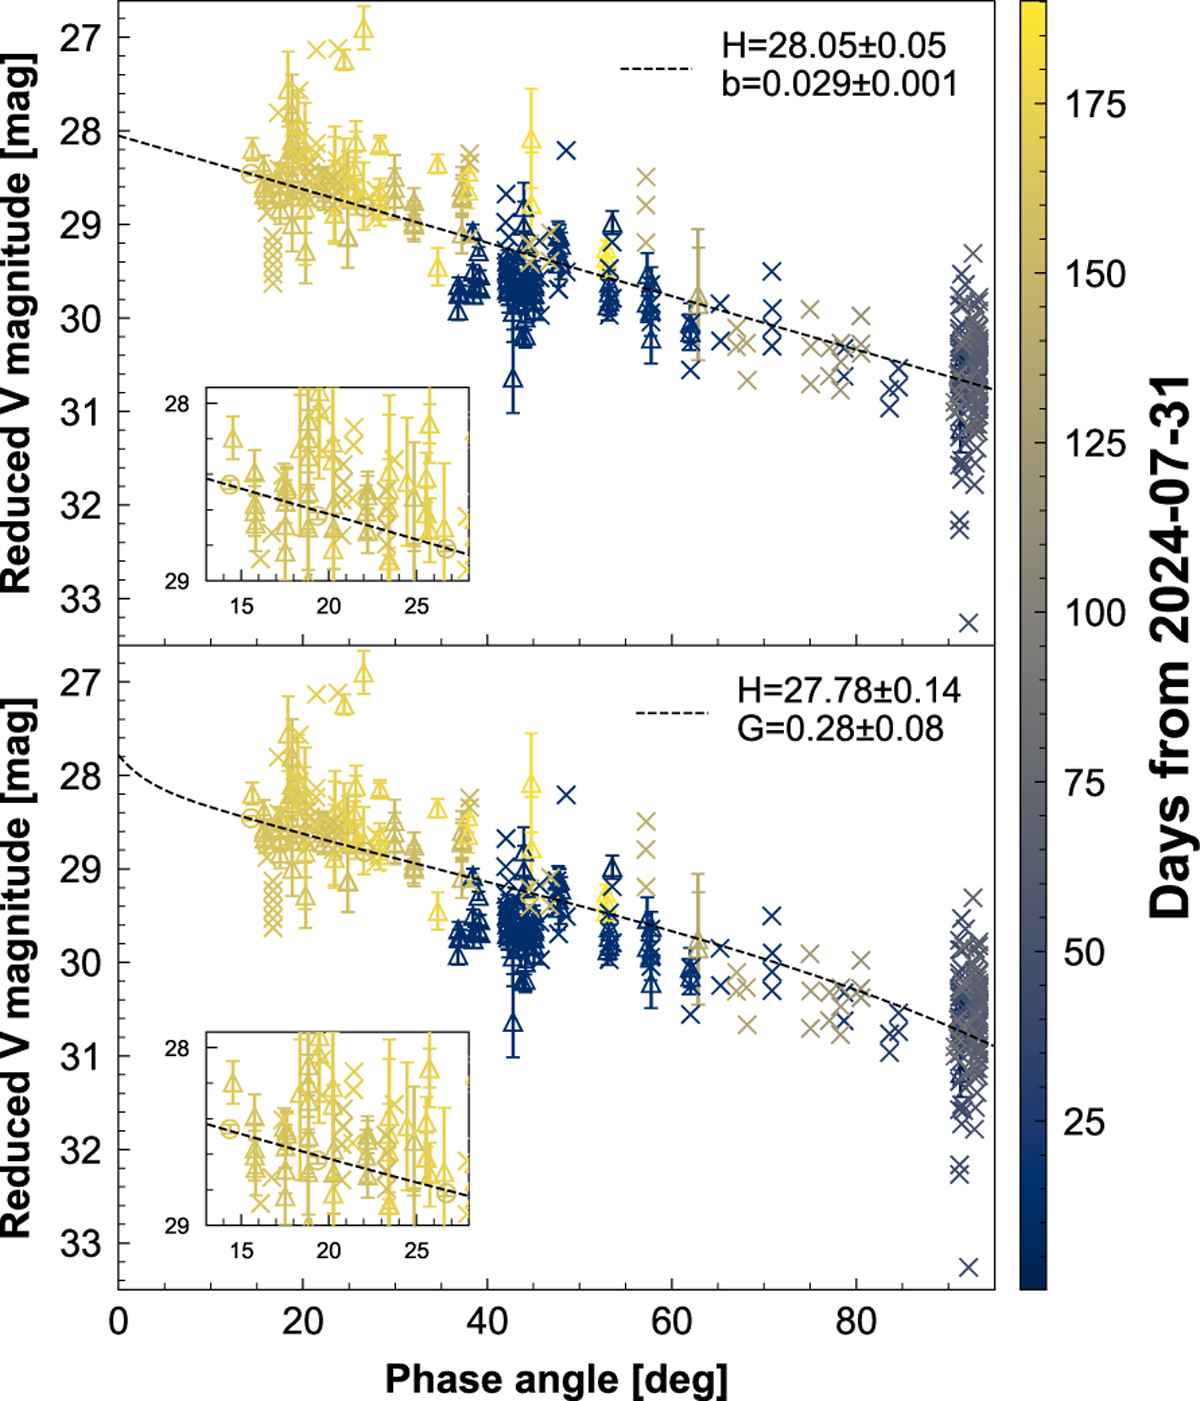
Phase angle dependence of reduced V-band magnitudes of 2024 PT5, including corrected observations from the MPC database. (top) Magnitudes obtained on the same day from Seimei/TriCCS are averaged and plotted by circles. Data from the MPC database with reported magnitude uncertainties are shown as triangles, while the ones without reported uncertainties are represented by crosses. Bars indicate the 1σ uncertainties. The fitting model curve with the linear model is presented as a dashed line. Each data point is color-coded by the observation date, expressed as days since July 31, 2024. The figure includes an inset plot that magnifies a region including data from Seimei/TriCCS. (bottom) Same as the top panel, but the data are fit with the H–G model.
Current usage metrics show cumulative count of Article Views (full-text article views including HTML views, PDF and ePub downloads, according to the available data) and Abstracts Views on Vision4Press platform.
Data correspond to usage on the plateform after 2015. The current usage metrics is available 48-96 hours after online publication and is updated daily on week days.
Initial download of the metrics may take a while.