| Issue |
A&A
Volume 700, August 2025
|
|
|---|---|---|
| Article Number | A183 | |
| Number of page(s) | 11 | |
| Section | Planets, planetary systems, and small bodies | |
| DOI | https://doi.org/10.1051/0004-6361/202555633 | |
| Published online | 15 August 2025 | |
Multi-epoch spectrophotometric characterization of the mini-moon 2024 PT5 in the visible and near-infrared
1
Université Côte d’Azur, Observatoire de la Côte d’Azur, CNRS, Laboratoire Lagrange,
Bd de l’Observatoire, CS 34229,
06304
Nice Cedex 4,
France
2
The Department of Earth and Planetary Science, The University of Tokyo,
7-3-1 Hongo,
Bunkyo,
Tokyo
113-0033,
Japan
3
Eureka Scientific,
Oakland,
CA
94602,
USA
4
Institute of Astronomy, V.N. Karazin Kharkiv National University,
35 Sumska Str.,
Kharkiv
61022,
Ukraine
5
School of Physics and Astronomy, University of Leicester,
Leicester
LE1 7RH,
UK
6
Griffith Observatory,
Los Angeles,
CA
90027,
USA
7
Division of Geological and Planetary Sciences, California Institute of Technology,
Pasadena,
CA
91125,
USA
8
Asahikawa Campus, Hokkaido University of Education,
Hokumon 9,
Asahikawa,
Hokkaido
070-8621,
Japan
9
Department of Earth and Planetary Sciences, Faculty of Science, Hokkaido University,
Kita-ku, Sapporo,
Hokkaido
060-0810,
Japan
★ Corresponding author: This email address is being protected from spambots. You need JavaScript enabled to view it.
Received:
22
May
2025
Accepted:
13
July
2025
Abstract
Context. 2024 PT5 is a tiny (D ≤ 10 m) near-Earth asteroid (NEA) discovered in August 2024. 2024 PT5 was gravitationally bound to the Earth-Moon system from September to November 2024 and classified as a mini-moon. Several quick response observations suggest that 2024 PT5 has a lunar ejecta origin, while the rotation state and albedo, essential properties for investigating its origin, are not well constrained.
Aims. We aim to characterize the spectrophotometric properties of 2024 PT5 by ground-based observations to test its taxonomic classification and origin.
Methods. We performed visible to near-infrared multicolor photometry of 2024 PT5 from data taken using the TriColor CMOS Camera and Spectrograph (TriCCS) on the Seimei 3.8 m telescope during January 4–10, 2025. The Seimei/TriCCS observations of 2024 PT5 cover phase angles from 14 deg to 27 deg, and were obtained in the ɡ, r, i, and ɀ bands in the Pan-STARRS system. In addition, we analyzed Y, J, H, and K photometry taken with the Multi-Object Spectrograph for Infrared Exploration (MOSFIRE) on the Keck I 10-m telescope on January 16–17, 2025.
Results. Our light curves show brightness variations over time periods of several tens of minutes. We infer that 2024 PT5 is in a tumbling state and has a light curve amplitude of about 0.3 mag. Visible and near-infrared color indices of 2024 PT5, ɡ – r = 0.567 ± 0.044, r – i = 0.155 ± 0.009, r – ɀ = 0.147 ± 0.066, Y – J = 0.557 ± 0.046, J – H = 0.672 ± 0.078, and H – Ks = 0.148 ± 0.098, indicate that 2024 PT5 is an S-complex asteroid, largely consistent with previous observations. Using the H–G model, we derived an absolute magnitude, HV,HG, of 27.72 ± 0.09 and a slope parameter, GV, of 0.223 ± 0.073 in the V band. A geometric albedo of 2024 PT5 was derived to be 0.26 ± 0.07 from the slope of its photometric phase curve. This albedo value is typical of the S- and Q-type NEAs.
Conclusions. Using the albedo and absolute magnitude, the equivalent diameter of 2024 PT5 is estimated to be 7.4 ± 1.0 m. The color properties of 2024 PT5 derived from our observations match the ones of rock samples taken from the lunar surface, which agrees with previous studies.
Key words: techniques: photometric / minor planets, asteroids: general / minor planets, asteroids: individual: 2024 PT5
© The Authors 2025
 Open Access article, published by EDP Sciences, under the terms of the Creative Commons Attribution License (https://creativecommons.org/licenses/by/4.0), which permits unrestricted use, distribution, and reproduction in any medium, provided the original work is properly cited.
This article is published in open access under the Subscribe to Open model. This email address is being protected from spambots. You need JavaScript enabled to view it. to support open access publication.
1 Introduction
The natural bodies gravitationally bound to the Earth-Moon system, with the exception of our Moon, are called mini-moons1. Depending on whether they are bound for more than or less than 1 orbital revolution, they are classified as temporally captured orbiters (TCOs) or temporally captured flybys (TCFs), respectively (e.g., Granvik et al. 2012, 2013; Jedicke et al. 2018). Mini-moons have similar heliocentric orbits with the Earth, and have low ∆v. Thus, mini-moons are possible targets of spacecraft missions, and their characterization by telescopic observations is essential (Jedicke et al. 2018). Only four mini-moons were discovered before August 2024: 1991 VG (de la Fuente Marcos & de la Fuente Marcos 2018), 2006 RH120 (Kwiatkowski et al. 2009), 2020 CD3 (Bolin et al. 2020; Fedorets et al. 2020b; de la Fuente Marcos & de la Fuente Marcos 2020; Naidu et al. 2021), and 2022 NX1 (de la Fuente Marcos et al. 2023). Dynamical studies have shown that lunar impacts can produce objects on Earth co-orbital orbits (Gladman et al. 1995; Jedicke et al. 2025). Observational studies of mini-moons and Earth co-orbitals in visible to near-infrared light support the possibility that some asteroids originate as lunar ejecta by showing their spectral similarity with lunar rock samples (Bolin et al. 2020; Sharkey et al. 2021; Bolin et al. 2025a).
The target of this paper, 2024 PT5, is the fifth mini-moon to have been discovered on August 7, 2024, by the Asteroid Terrestrial-impact Last Alert System in South Africa (Denneau et al. 2024; Bolin et al. 2025a). Soon after the discovery, telescopic observations of 2024 PT5 were made worldwide, as is summarized in Table 1. Fig. 1 shows the predicted magnitude and solar phase angles of 2024 PT5.
Bolin et al. (2025a) performed visible to near-infrared (0.475–0.880 μm)2 spectrophotometry of 2024 PT5 using the Gemini Multi-Object Spectrograph (GMOS) on the Gemini North telescope on 2024 September 27. They found that the spectrum of 2024 PT5 best matches lunar rock samples followed by S-complex asteroids, making it the third known asteroid with a spectrum similar to lunar rock, following 2020 CD3 and (469219) Kamo‘oalewa (Bolin et al. 2020; Sharkey et al. 2021; Bolin et al. 2025a).
Kareta et al. (2025) later reported visible multicolor photometry of 2024 PT5 using the Lowell Discovery Telescope (LDT) on 2024 August 14. Then they activated target-of-opportunity programs of visible and near-infrared spectroscopy of 2024 PT5 using the LDT and NASA Infrared Telescope Facility on 2024 August 16. Their visible to near-infrared (~0.40 μm – 2.45 μm reflectance spectrum of 2024 PT5, covering a broad wavelength range, is in agreement with the results of Bolin et al. (2025a), showing that it is compatible with lunar samples.
Additionally, de la Fuente Marcos et al. (2025) characterized 2024 PT5 using the 10.4 m Gran Telescopio Canarias (GTC), the Two-meter Twin Telescope (TTT), and the Transient Survey Telescope (TST) in the Canary Islands. Three visible to near-infrared (0.480–0.920 μm) spectra of 2024 PT5 were obtained using the OSIRIS spectrograph on the GTC on 2024 September 7. Also, light curve observations of 2024 PT5 were performed using the GTC/OSIRIS on 2024 September 28. Moreover, the astrometric observations were obtained using the TTT1, TTT2, and the TST. Their visible to near-infrared spectrum is also in agreement with the results of Bolin et al. (2025a), which showed that the visible to near-infrared (0.475–0.880 μm spectrum of 2024 PT5 matches powder samples of a mare breccia of the Moon collected by the Luna 24 mission.
The rotation state of 2024 PT5 is still unclear, though state-of-the-art ground-based telescopes were used to characterize 2024 PT5. The rotation state is essential to investigate its origin. For instance, the tumbling state of 2024 PT5 would support the lunar ejecta origin (Harris 1994). This is because a tumbling motion is a natural outcome after the collisional event. Bolin et al. (2025a) and de la Fuente Marcos et al. (2025) report that 2024 PT5 is possibly rotating with a rotation period shorter than ~1 h, while Kareta et al. (2025) conclude that there is no clear periodicity in their light curves. Also, the geometric albedo of 2024 PT5 is not estimated, though it is another crucial quantity for investigating the surface properties.
In this paper, we report the results of visible multicolor photometry of 2024 PT5 for one week in January 2025, when 2024 PT5 was brighter than 20 mag in visible wavelengths and can be observed in a wide range of phase angles, as is seen in Fig. 13. The paper is organized as follows. In Sect. 2, we describe our photometric observations and data reduction with Seimei/TriColor CMOS Camera and Spectrograph (TriCCS) and Keck/Multi-Object Spectrograph for Infrared Exploration (MOSFIRE). The results of the observations are presented in Sect. 3. The constraints on the physical properties of 2024 PT5 and its origin are discussed in Sect. 4.
Summary of the existing observations.
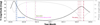 |
Fig. 1 Predicted magnitude (solid line) and phase angles (dashed line) of 2024 PT5 obtained from NASA JPL Horizons using the Python package astroquery (Ginsburg et al. 2019). Vertical lines show our observations and previous observations: spectrophotometry and spectroscopy in Kareta et al. (2025) (dash-dotted lines), spectroscopy and light curve observations in de la Fuente Marcos et al. (2025) (double dash-dotted lines), spectrophotometry in Bolin et al. (2025a) (dotted line), and this study (triple dash-dotted lines). |
Summary of the observations.
 |
Fig. 2 Non-sidereally stacked images in ɡ, r, i, and ɀ bands with a total integration time of 100 s on January 4, 2024, are shown. Circles indicate 2024 PT5. The field of view covers 45 arcsec × 45 arcsec. North is to the top and east is to the left. |
2 Observations and data reduction
We obtained multicolor photometry of 2024 PT5 in January 2025. The observing conditions are summarized in Table 2. The predicted V-band magnitudes, phase angles, distances between 2024 PT5 and the observer, and distances between 2024 PT5 and the Sun in Table 2 were obtained from NASA JPL Horizons4 using the Python package astroquery (Ginsburg et al. 2019).
2.1 Seimei telescope
We observed 2024 PT5 using the TriCCS on the 3.8 m Seimei telescope (Kurita et al. 2020) on January 4, 7, and 10, 2025. The telescope is located at the Kyoto University Okayama Observatory (133.5967° E, 34.5769° N, and 355 m in altitude). We simultaneously obtained three-band images in the Pan-STARRS (ɡ, r, i) and (ɡ, r, ɀ) filter (Chambers et al. 2016). The field of view is 12.6′ × 7.5′ with a pixel scale of 0.350 arcsec pixel–1.
A phase angle of 2024 PT5 changed from 28.7 deg on January 4, 2025, to 14.3 deg on January 10, 2025. 2024 PT5 had a geocentric distance of about 0.012 au and a heliocentric distance of about 0.994–0.995 au throughout the observing period. The lunar phases on January 4, 7, and 10, 2025, were ~0.2, ~0.6, and ~0.9, respectively. The lunar elongations on January 4, 7, and 10, 2024, were ~120 deg, ~80 deg, and ~30 deg, respectively. The apparent sky motion of 2024 PT5 was about 0.13–0.15 arcsec s–1. The seeing measured by using in-field stars was 2.7–3.3 arcsec in the r band.
Non-sidereal tracking was performed during the observations of 2024 PT5. Exposure times were set to 5 s for all observations. We took multiple images with short exposures rather than a single image with long exposures in our observations to avoid having elongated photometric reference stars and also to eliminate the cosmic rays. We performed standard image reduction, including bias subtraction, dark subtraction, and flat-fielding. The astrometry of reference sources from the Gaia Data Release 2 was performed using the astrometry.net software (Lang et al. 2010).
We performed stacking of images before photometry to increase the signal-to-noise ratio (S/N) of 2024 PT5, avoiding the elongations of their images as is shown in the upper panels of Fig. 2 (hereinafter referred to as the non-sidereally stacked image). The S/N of 2024 PT5 in the single 5 s images is less than ten. The S/N of 2024 PT5 on January 10, 2024, especially are lower than the others due to the larger lunar phase (~0.9) and smaller lunar elongation (~30 deg), and the target is barely visible in individual frames. We stacked 20 or 40 successive images with exposure times of 5 s, and obtained images with effective exposure times of 100 s or 200 s. A typical readout time of the CMOS sensors on TriCCS is 0.4 milliseconds, which is negligibly small compared to the exposure time of 5 s. We also stacked images using the world coordinate system of images corrected with the surrounding sources to suppress the elongations of the images of reference stars (hereafter referred to as the sidereally stacked image).
We derived colors and magnitudes of 2024 PT5 following the same procedure used in Beniyama et al. (2023a,b,c, 2024). Cosmic rays were removed with the Python package astroscrappy (McCully et al. 2018) using the Pieter van Dokkum’s L.A.Cosmic algorithm (van Dokkum 2001). The circular aperture photometry was performed for 2024 PT5 using the SExtractor-based Python package sep. The aperture radii were set to 15 pix, which is about 1.5–2.0 times as large as the full widths at half maximum (FWHMs) of the PSFs of the reference stars in the sidereally stacked images, and annuli from 18 to 28 pix from the center were used to estimate the background level and noise for 2024 PT5. The circular aperture photometry was performed for the reference stars using sep, with a circular aperture after global background subtraction. The aperture radii were set to 15 pix as the photometry of 2024 PT5. The photometric results of 2024 PT5 and reference stars were obtained from the non-sidereal and sidereal stacked images, respectively.
All images were calibrated using Pan-STARRS catalog Data Release 2 (DR2, Chambers et al. 2016). Reference stars that met any of the following criteria were excluded from the analysis: uncertainties in the ɡ, r, i, or ɀ band magnitudes in the catalog larger than 0.05 mag; (ɡ – r)PS > 1.1; (ɡ – r)PS < 0.0; (r – i)PS > 0.8; or (r – i)PS < 0.0, where (ɡ – r)PS and (r – i)PS are colors in the Pan-STARRS system. Photometric measurements within 100 pixels of the edges of the image or contaminated by nearby sources within the aperture were excluded on a frame-by-frame basis. Extended sources, possible quasars, and variable stars were removed using objinfoflag and objfilterflag in the Pan-STARRS catalog. Typically a few dozen reference stars were used in each frame. When the number of stars in each frame was less than five, we did not use that frame to avoid any systematics in its color and/or magnitude estimates. The typical uncertainties in magnitude zero points were less than 0.01 mag.
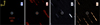 |
Fig. 3 Non-sidereally stacked images in Y, J, H, and K bands with a total integration time of 150 s on January 16 or 17, 2024, are shown. Circles indicate 2024 PT5. The field of view covers 45 arcsec × 45 arcsec. North is to the top and east is to the left. |
2.2 Keck telescope
Observations of 2024 PT5 were obtained at the Keck Observatory with the MOSFIRE instrument on the Keck I 10-m telescope on Maunakea on January 16, 2025, under program R332 (PI: Bolin) and N085 (PI: Bolin). MOSFIRE has a 6.12′ × 6.12′ field of view, plate scale of 0.18 arcsec/pixel, and possesses a Y filter (central wavelength 1.048 μm, FWHM 0.152 μm), J filter (central wavelength 1.253 μm FWHM 0.200 μm), H filter (central wavelength 1.637 μm, FWHM 0.341 μm), and K filter (central wavelength 2.147 μm FWHM 0.314 μm (McLean et al. 2012).
On January 16, 2025, 2024 PT5 had a phase angle of 18.5 deg, a geocentric distance of 0.013 au, and a heliocentric distance of 0.996 au, and on January 17, 2025, 2024 PT5, had a phase angle of 20.6 deg, a geocentric distance of 0.013 au, and a heliocentric distance of 0.996 au. The apparent sky motion of 2024 PT5 was about 0.12 arcsec s–1. The seeing measured by using in-field stars was ~0.9 arcsec in the Y, J, and H bands on January 16, 2025, and ~0.6 arcsec in the Y and K bands on January 17, 2025. The asteroid was observed in the Y, J, and H filters on January 16, 2025, and in the Y and K filters on January 17, 2025 (Fig. 3). Exposure times were set to 30 s for all observations with a five-point dither pattern. The telescope was tracked at the rate of motion of the asteroid. Filters were changed between groups of five exposures between the Y, J, and H filters on January 16, 2025, and between the Y and K filters on January 17, 2025, to mitigate light curve effects on the photometry. Calibration was completed by using in-field solar-like stars from the Pan-STARRS and 2MASS catalogs (Skrutskie et al. 2006; Tonry et al. 2012). Around ten stars were used per image depending, and catalog uncertainties for the standard stars in the Y, J, H, and K bands ranged between 0.02 and 0.09 mag.
3 Results
3.1 Light curves, rotation period, and axial ratio
The light curves of 2024 PT5 are shown in Fig. 4. We see variations with amplitudes of approximately 0.3 mag in all light curves. The light curve obtained on January 4, 2025, has an observation arc longer than 2 h, and the corresponding light curve in the r band is presented in Figure 5. This is longer than any existing observations (see Table 1).
We performed the periodic analysis with the three r-band light curves obtained on January 4, 2025, using the Lomb-Scargle technique (Lomb 1976; Scargle 1982; VanderPlas 2018). The Lomb-Scargle periodograms with a period range between 200 and 8161 s are shown in Fig. 6. We showed 90.0, 99.0, and 99.9% confidence levels in the periodogram. The minimum and maximum of the period range correspond to twice the sampling rate and observation arc, respectively. We found no periodicity in our light curves.
We assumed that the asteroid is a triaxial ellipsoid with axial lengths of A, B, and C (A ≥ B ≥ C) and an aspect angle, the angle between the rotation axis and the asteroid-observer direction, of 90 deg. A lower limit of the axial ratio A/Β was estimated as follows:
 (1)
(1)
where m(α) is the light curve amplitude at a phase angle of α and s is a slope depending on the taxonomic type of the asteroid (Bowell et al. 1989). When we assume s of 0.030, a typical value of S-type asteroids (Zappala et al. 1990), and a light curve amplitude of 0.3, the axial ratio A/B of 2024 PT5 is larger than 1.17.
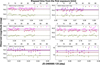 |
Fig. 4 Light curves of 2024 PT5. The observed ɡ, r, i, and ɀ band magnitudes are presented as circles, triangles, squares, and diamonds, respectively. Bars indicate the 1σ uncertainties. The arithmetic average of magnitude in each light curve is presented with a dashed line. Shaded areas indicate the standard errors of the averaged magnitudes. |
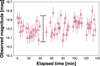 |
Fig. 5 Light curves of 2024 PT5 in the r band on January 4. Bars indicate the 1σ uncertainties. The variation in the light curve, 0.3 mag, is indicated. |
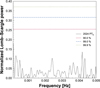 |
Fig. 6 Lomb-Scargle periodogram of 2024 PT5. The number of harmonics of the model curve is unity. Horizontal dashed, dash-dotted, and dotted lines show 90.0, 99.0, and 99.9% confidence levels, respectively. |
3.2 Colors
The averages and standard deviations of the mean colors of 2024 PT5 calculated for each observing block were derived as ɡ – r = 0.567 ± 0.044, r – i = 0.155 ± 0.009, and r – ɀ = 0.147 ± 0.066. We summarize the derived colors of 2024 PT5 and the ones reported in previous studies in Table 3. We converted colors from Bolin et al. (2025a) in the SDSS system into the Pan-STARRS system using the following equations (Tonry et al. 2012):
 (2)
(2)
 (3)
(3)
 (4)
(4)
 (5)
(5)
where ɡ, r, i, and ɀ are magnitudes in the Pan-STARRS system, while ɡSDSS, rSDSS, iSDSS, and ɀSDSS are magnitudes in the SDSS system. We computed the propagated uncertainties of the colors in the Pan-STARRS system with the photometric errors and uncertainties in conversions. Table 3 also includes colors of Kamo‘oalewa from Sharkey et al. (2021) and lunar rock core samples from Isaacson et al. (2011). We used the techniques from Bolin et al. (2021,2022) to estimate the visible colors in the Pan-STARRS system from spectra. We used the spectroscopy module from sbpy, an astropy-affiliated package for small-body planetary astronomy (Mommert et al. 2019), and solar colors from Willmer (2018).
We present the derived colors of 2024 PT5 in Fig. 7 with the ones of asteroids from the recent catalog (Sergeyev & Carry 2021). In this catalog, the probabilities of the asteroid complex are assigned for each asteroid. We extracted asteroids with 80% or higher probabilities of belonging to a specific complex except for U, which indicates an unknown class. We calculated ɡ – r, r – i, and r – ɀ in the SDSS system, and then converted these colors into the Pan-STARRS system using equations given in Tonry et al. (2012). By a visual inspection, 2024 PT5 is overlapping with S-complex asteroids and lunar samples in the color-color diagrams.
We presented the derived near-infrared colors of 2024 PT5 in Fig. 8. We also plotted near-infrared colors of near-Earth asteroids (NEAs) from the literature: S-type (433) Eros (Chapman & Morrison 1976), S-type (25143) Itokawa (Ishiguro et al. 2003), S-type (1862) Apollo and C-type (4015) Wilson-Harrington (Hartmann et al. 1982), X-type 2012TC4 (Urakawa et al. 2019; Reddy et al. 2019), and L-type (367943) Duende (de Leόn et al. 2013; Takahashi et al. 2014). Small Solar System bodies were serendipitously observed by survey observations in the near-infrared using 4.1 m Visible and Infrared Survey Telescope for Astronomy (VISTA) at ESO’s Cerro Paranal Observatory, Chile. Infrared colors of minor bodies were extracted in Popescu et al. (2016, 2018). We present the infrared colors of S-, C-, and X-type asteroids in Fig. 8 for comparison. We computed the Y-J, Y-H, and J-H colors using the Y, J, and H observations from January 16, 2025. We computed the Y-Ks color of 2024 PT5 using the Y and Ks observations from January 17, 2025. The near-infrared colors of 2024 PT5 are comparable to those of a Q-type asteroid Apollo and lunar samples, and J-H color is redder than those of S types, Eros, and Itokawa. The Y-J color of 2024 PT5 is estimated to be Y – J = 0.557 ± 0.046. To compute the H-Ks color of 2024 PT5, we subtracted the Y-H color of 2024 PT5 based on the Y and H observations taken on January 16, 2025, from the Y-Ks color obtained from the Y and Ks observations on January 17, 2025. The near-infrared color of 2024 PT5 is similar to that of the small S-complex ΝΕΑ 2024 YR4, measured with the same instruments (Bolin et al. 2025b), and consistent with its J-H and H-Ks colors. However, we identified possible systematics in the Y–J color, likely caused by differences between the MOSFIRE and Pan-STARRS Y-band filter response functions. Therefore, we excluded the Y–J color of 2024 PT5 in the subsequent analysis.
Colors in the Pan-STARRS system.
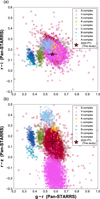 |
Fig. 7 Color-color diagram of (a) ɡ-r vs. r-i and (b) ɡ-r vs. r-ɀ. Means of the individual nightly mean colors of 2024 PT5 are plotted with stars. Error bars indicate the standard deviation of nightly mean colors. Error bars indicate the 1σ uncertainties. Asteroids from Sergeyev & Carry (2021) are also plotted: S-complex (circles), V-complex (triangles), X-complex (squares), K-complex (diamonds), L-complex (inverse triangles), C-complex (left-pointing triangles), B-complex (right-pointing triangles), D-complex (pentagons), and A-complex (hexagons). |
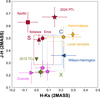 |
Fig. 8 Color-color diagram of J-H vs. J-Ks. Colors of 2024 PT5 are plotted with a star. Colors of NEAs in the literature are plotted: Eros (circle) (Chapman & Morrison 1976), Itokawa (triangle) (Ishiguro et al. 2003), Apollo (square) (Hartmann et al. 1982), 2012 TC4 (diamond and inverse triangle) (Urakawa et al. 2019; Reddy et al. 2019), Wilson-Harrington (left-pointing triangle) (Hartmann et al. 1982), and Duende (right-pointing triangle and pentagon) (de Leόn et al. 2013; Takahashi et al. 2014). Error bars indicate the 1σ uncertainties. Average near-infrared colors of S, C, and X types observed by VISTA-VHS are also indicated with rectangles (Popescu et al. 2016). The colors of the lunar rock core samples of Isaacson et al. (2011) and Kamo‘oalewa of Sharkey et al. (2021) are also shown with an octagon and elongated diamond, respectively. The error bars correspond to the uncertainties of the 1σ envelope of the compiled spectra in Fig. 12. |
3.3 Phase curve
We observed 2024 PT5 across a wide phase angle range, from 14.3 deg to 26.8 deg. The Pan-STARRS magnitudes in the ɡ and r bands were converted to Johnson V-band magnitudes using the following transformation provided by Tonry et al. (2012):
 (6)
(6)
The phase curves of 2024 PT5 in the V band are shown in Fig. 9.
Since our phase curve lacks observations at lower phase angles, where opposition surges appear, we fit it with simple models. We derived an absolute magnitude and slope of the phase curve with the linear model:
 (7)
(7)
where HV,linear is an absolute magnitude in the V band and b is the slope of the fitting curve. We also derived an absolute magnitude and slope of the phase curve with the H–G model (Bowell et al. 1989):
 (8)
(8)
where HV,HG is an absolute magnitude in the V band and G is the slope of the fitting curve. Φ1 and Φ2 are phase functions written as follows, with a basic function, W:
 (9)
(9)
 (10)
(10)
 (11)
(11)
The uncertainties of HV,linear, b, HV,HG, and G were estimated with the Monte Carlo technique. We made 3000 phase curves by randomly resampling the data, assuming that each observed datum follows a normal distribution whose standard deviation is the standard error of the error-weighted average magnitude. We derived fitting parameters as follows: HV,linear = 28.06 ± 0.05, b = 0.029 ± 0.002 mag deg–1, HV,HG = 27.72 ± 0.09, and G = 0.223 ± 0.073.
The Minor Planet Center (MPC) database contains 410 observations of 2024 PT5 obtained from 44 different observatories. Of these, 404 observations include reported magnitudes.
We used this dataset to estimate the phase curve of 2024 PT5. To merge the heterogeneous data into a single reference photometric system, we collected observations of various asteroids from the MPC that were obtained using the same observatories and filters. We then computed the differences between the reported and predicted V magnitudes for these reference asteroids. The predicted V magnitudes were obtained using the Miriade software. These differences were used to correct the reported magnitudes of 2024 PT5 to build a consistent dataset, as is shown inFig. 10.
The fitting yielded the following parameters: HV,linear = 28.05 ± 0.05, b = 0.029 ± 0.001 mag deg–1, HV,HG = 27.78 ± 0.14, and G = 0.28 ± 0.08. The uncertainties in the parameters are given by the 1σ calculated as the square roots of the diagonal elements of the covariance matrix. These values are consistent with the ones derived from our own measurements; however, the associated uncertainties are larger. Therefore, we adopt the parameters obtained solely from our measurements in the following discussion. We note that our computation is based on only three points, while the MPC data includes 404 points. Nevertheless, the results are very similar, and the consistency in the results confirms the reliability of our values.
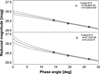 |
Fig. 9 Phase angle dependence of reduced V magnitudes of 2024 PT5. Bars indicate the 1σ uncertainties. All magnitudes obtained on the same day are averaged and plotted, (top) The medians (50th percentile) of fitting model curves with the linear model are presented as solid lines, (bottom) The medians (50th percentile) of fitting model curves with the H–G model are presented as solid lines. Uncertainty envelopes representing the 95% highest density interval values are shown with dashed lines. |
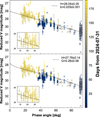 |
Fig. 10 Phase angle dependence of reduced V-band magnitudes of 2024 PT5, including corrected observations from the MPC database. (top) Magnitudes obtained on the same day from Seimei/TriCCS are averaged and plotted by circles. Data from the MPC database with reported magnitude uncertainties are shown as triangles, while the ones without reported uncertainties are represented by crosses. Bars indicate the 1σ uncertainties. The fitting model curve with the linear model is presented as a dashed line. Each data point is color-coded by the observation date, expressed as days since July 31, 2024. The figure includes an inset plot that magnifies a region including data from Seimei/TriCCS. (bottom) Same as the top panel, but the data are fit with the H–G model. |
4 Discussion
4.1 Physical properties
The rotation state of 2024 PT5 is still not clear, even with our light curves throughout more than 2 h. The possibility that these variations are due to noise cannot be excluded. However, all published light curves, including ours, exhibit variations with a period of several tens of minutes. This indicates a tumbling motion of 2024 PT5, which has been noted in previous studies (Kareta et al. 2025; de la Fuente Marcos et al. 2025). The fact that 2024 PT5 is a tumbling asteroid supports the lunar ejecta origin, since a tumbling motion is expected after the collisional event (Harris 1994). We note that the tidal force can change the rotation state of 2024 PT5 during the close approach, as is reported for another tiny NEA (367943) Duende (a.k.a. 2012 DA14, Moskovitz et al. 2020; Benson et al. 2020). 2024 PT5 experienced a close approach with a distance of 0.00379 au or 1.5 Lunar distances (LDs) from the Earth on August 8, 2024. The close encounter on August 8, 2024, and/or earlier close encounters may have changed the spin state of 2024 PT5, inducing a tumbling state. This effect will be studied well for (99942) Apophis in 2029 during its ~0.07 LD close approach (Ballouz et al. 2024).
The derived visible colors of 2024 PT5 in Table 3 and Fig. 7 are largely consistent with previous measurements by Bolin et al. (2025a) and Kareta et al. (2025), but with some differences of about 0.1 mag at most. This can be qualitatively explained by the fact that 2024 PT5’s surface is not homogeneous within the uncertainties of measurements. Since our observation geometry was dramatically different from the ones in other studies, as is shown in Fig. 11, we might observe a different side of 2024 PT5 compared to observations in 2024. However, qualitatively it is unrealistic to detect a change in colors of about 0.1 mag unless roughly half of the 2024 PT5’s surface had a significantly different composition compared to the other half. A possible explanation is that 2024 PT5 is tumbling, and the derived colors in previous observations are affected by the complex brightness variations. The simultaneous multicolor photometry we performed is a reliable method, unaffected by a possible complex rotation of 2024 PT5 and less affected by observational artifacts.
As in the case of the rotation state, we note that close encounters with planets can change the surface properties, exposing fresh unweathered surface grains (e.g., Binzel et al. 2010). Very recently, however, McGraw et al. (2024) observed 2024 MK, a S-complex NEA similar to 2024 PT5, before and after its close approach of 0.76 LD from the Earth. They obtained multiple high-quality visible to near-infrared spectra of 2024 MK using IRTF/SpeX on Mauna Kea. They found no planetary-encounter-induced spectral changes in the close approach, in contrast to previous works (e.g., Binzel et al. 2010), and concluded that a single close encounter at 0.76 LD may not be enough to cause a detectable change in ground-based observations. As in the case of 2024 MK in McGraw et al. (2024), the phase reddening effect is also negligible for 2024 PT5, since our observations are performed at phase angles of less than 26.8 deg.
The b parameter derived in Sect. 3.3 has a tight correlation with the geometric albedo (Belskaya & Shevchenko 2000):
 (12)
(12)
where C1 and C2 are parameters obtained with phase slopes of asteroids whose albedo is estimated from thermal infrared observations. We used updated parameters, C1 = 0.016 ± 0.001 and C2 = 0.022 ± 0.001, from Shevchenko et al. (2021). High-albedo asteroids have a shallower slope (smaller b) in the phase curves, since the contribution of shadowing decreases as the albedo increases (Belskaya & Shevchenko 2000). For instance, Shevchenko et al. (2012) estimated b = 0.040–0.045 mag deg–1 for low-albedo Jupiter Trojans, Ishiguro et al. (2014) estimated b = 0.039 ± 0.001 mag deg–1 for the low-albedo NEA (162173) Ryugu, and Reddy et al. (2015) estimated b = 0.0225 ± 0.0006 mag deg–1 for the high-albedo V-type NEA (357439) 2004 BL86.
We estimated a geometric albedo of 2024 PT5 as 0.26 ± 0.07 with bV derived from only our measurements. This is a fairly good match to S-type  and Q-type
  NEAs (Marsset et al. 2022). This is confirmed from our GV of 0.223 ± 0.073, which is consistent with a typical value for S types (Warner et al. 2009). The diameter of 2024 PT5 can be estimated with our updated HV,HG and pV using the following equation (Fowler & Chillemi 1992; Pravec & Harris 2007):
 (13)
(13)
The diameter of 2024 PT5 is estimated to be 7.4 ± 1.0 m, which is consistent with the previous estimates, 5.4 ± 1.2 m (Bolin et al. 2025a) and 8 ≤ D ≤ 12 m (Kareta et al. 2025).
A caveat is that it is unclear if we can apply the empirical relationship of Eq. (12) to such a tiny asteroid. The empirical relation in Belskaya & Shevchenko (2000); Shevchenko et al. (2021) is based on the WISE and AKARI measurements of relatively large asteroids, and it may not apply to tiny asteroids such as 2024 PT5 if their surface properties are different from the ones of large asteroids. Hasselmann et al. (2024) reported an unusual photometric phase curve of the NASA DART mission (Rivkin et al. 2021; Daly et al. 2023) and the ESA HERA mission (Michel et al. 2022) target S-type NEA (65803) Didymos (D ~ 800 m). They intensively analyzed the photometric phase curve of Didymos obtained at a wide range of phase angles, focusing not only on the linear slope but also on the opposition effect. They concluded that the photometric phase curve parameters are similar to the ones of M-type or C-complex asteroids, depending on the model used. To quantitatively estimate the albedo, cross validations by thermal infrared observations and/or polarimetry are important (e.g., Selmi et al. 2025). As for Didymos, it is expected that the Hera mission might end the discussion related to its surface properties. The Hayabusa2 extended mission (Hirabayashi et al. 2021) and Tianwen-2 mission (Zhang et al. 2021) will also enhance our understanding of two tiny and fast-rotating NEAs, 1998 KY26 (D ≤ 40 m) and Kamo‘oalewa (D ≤100 m), respectively.
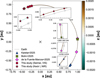 |
Fig. 11 Heliocentric positions of 2024 PT5 and Earth at the time of observations in Kareta et al. (2025), Bolin et al. (2025a), de la Fuente Marcos et al. (2025), and this study. The positions of 2024 PT5 and Earth are indicated by filled markers and open markers, respectively. The orbits of 2024 PT5 and Earth are shown with solid and dashed lines, respectively. The color of the solid line indicates the ɀ coordinate (vertical position) of 2024 PT5 in the heliocentric frame. The figure includes multiple inset plots that magnify specific regions. Although their scales differ, the aspect ratio is kept constant. |
4.2 Origin of 2024 PT5
Previous studies have shown that the reflectance spectra of 2024 PT5 match the ones of the lunar samples (Bolin et al. 2025a; Kareta et al. 2025; de la Fuente Marcos et al. 2025). Bolin et al. (2025a) conclude that the physical properties of 2024 PT5 are compatible with an inner main belt or lunar ejecta, with a preference for the latter, while both Kareta et al. (2025) and de la Fuente Marcos et al. (2025) conclude that their reflectance spectra are suggestive of a lunar origin. Their arguments are based on the similarity of reflectance spectra. de la Fuente Marcos et al. (2025) compare their visible to near-infrared (0.475–0.880 μm) reflectance spectrum of 2024 PT5 with template spectra from DeMeo et al. (2009), and show that the best-matching template is Sv type, while they compare the spectrum of 2024 PT5 with over 15 000 spectra of meteorites, terrestrial rocks, and lunar soils in the RELAB database (Pieters 1983) using the M4AST tool (Popescu et al. 2012). Similarly, Kareta et al. (2025) compare their visible to near-infrared (~0.40–2.45 μm) reflectance spectrum of 2024 PT5 with template spectra from DeMeo et al. (2009) and conclude that no taxonomic class fits the spectrum of 2024 PT5. They compare the spectrum of 2024 PT5 with every sample in the RELAB database.
The reflectance spectra of 2024 PT5 in Fig. 12 were calculated with the derived and solar colors in the same manner as in Beniyama et al. (2023b,a). For ɡ, r, r, and ɀ measurements, The reflectances at the central wavelength of the ɡ, V, r, i, ɀ, J, H, and Ks bands, Rɡ, RV, Rr Ri, Rɀ, RJ, RH, and  , were calculated as
![Mathematical equation: ${R_x} = {10^{ - 0.4\left[ {{{\left( {x - y} \right)}_{{\rm{P}}{{\rm{T}}_5}}} - {{\left( {x - y} \right)}_ \odot }} \right]}},$](/articles/aa/full_html/2025/08/aa55633-25/aa55633-25-eq17.png) (14)
(14)
where x and y are the indices of the bands. The reflectance in the x band is normalized relative to that of the y band.  is the color of 2024 PT5, and (x – y)⊙ is the color of the Sun. We referred to the absolute magnitude of the Sun in the AB system as ɡ = 5.03, r = 4.64, i = 4.52, and ɀ = 4.51, and in the Vega system as V = 4.81, J = 3.67, H = 3.32, and Ks = 3.27 (Willmer 2018).
Using the seven band measurements in the visible to near-infrared, we tried to assess our 2024 PT5’s spectrum. However, we cannot naturally connect our spectrum’s visible and near-infrared portions. This could be due to the difference in observing geometries between Seimei/TriCCS and Keck/MOSFIRE observations, shown in Fig. 11; the cross section of the asteroid might have changed after Seimei/TriCCS observations owing to the changing aspect angle (Kwiatkowski & Kryszczynska 1992; Jackson et al. 2022; Carry et al. 2024). Thus, we considered the visible and near-infrared measurements separately. We normalized reflectance spectra to unity at the V (0.5511 μm) and J bands (1.2393 μm) (Willmer 2018) in the visible and near-infrared wavelength portions of our spectrum, as is seen in the left and right panels of Fig. 12. Our visible spectra derived from colors are consistent with the spectrophotometry results in Bolin et al. (2025a) and Kareta et al. (2025)5 as well as visible spectra shown in Kareta et al. (2025) and de la Fuente Marcos et al. (2025).
In Fig. 12, Mahlke templates of S- and A-type asteroids (Mahlke et al. 2022), a spectrum of Kamo‘oalewa (Sharkey et al. 2021), and lunar rock core samples (Isaacson et al. 2011) are shown for comparison. The envelopes of lunar rock core samples were provided by Isaacson et al. (2011) by taking the average of lunar samples. In visible wavelengths, our spectrum matches well with both asteroids, such as S- and A-type templates, and lunar rock core samples. In the near-infrared wavelengths, the closest match is to lunar rock samples. These findings are consistent with previous studies (Bolin et al. 2025a; Kareta et al. 2025; de la Fuente Marcos et al. 2025). When considered separately, our reflectance spectrum is almost identical to that of Kamo‘oalewa in visible and near-infrared wavelengths. However, the combined spectrum is less red than that of Kamo‘oalewa, reported in Kareta et al. (2025).
The orbital evolution of 2024 PT5 before 1937 cannot be reconstructed due to a close encounter with Earth that causes orbital divergence (Kareta et al. 2025; de la Fuente Marcos et al. 2025). Therefore, to investigate the origin of 2024 PT5 from a dynamical point of view we need to compare the likelihood of a lunar ejecta origin and a ΝΕΟ population origin. Fedorets et al. (2020b) explored the likelihood of a lunar éjecta origin of the mini-moon 2020 CD3 by examining the contemporary production rate of small craters on the Moon, with plausible assumptions regarding their properties (e.g., ejecta/impactor diameter ratio, ejecta speed). They rule out a lunar ejecta origin for 2020 CD3, and conclude that mini-moon capture from the ΝΕΟ population (Granvik et al. 2012; Fedorets et al. 2017) is a dominant mechanism for maintaining the mini-moon steady-state population.
Recently, Jedicke et al. (2025) assessed the likelihood of both ΝΕΑ origin (Granvik et al. 2012; Fedorets et al. 2017) and lunar ejecta origin for mini-moons using the steady-state size frequency distribution (SFD). As they discuss in the paper, there is systematic uncertainty of at least a few orders of magnitude on their SFD of lunar ejecta, taking the crater scaling relation, ejecta SFD, and ejecta size-speed relation into account. Thus, due to the model’s large uncertainties, we cannot conclude whether a ΝΕΑ origin or a lunar origin is preferred.
We cannot come to a conclusion about the origin of 2024 PT5 with our current knowledge from the discussion above, even when spectral and dynamical evidence are considered together. This conclusion is also valid for the mini-moon 2020 CD3. The visible geometric albedo of the Moon was derived in previous studies (e.g., Table 4 of Warell 2004). The estimated bulk visible geometric albedo of the Moon is ~0.15. The area ratio of lunar mare and highland regions is around 43 and 57%, and the albedo for mare and highland is ~0.1 and ~0.2 (Korokhin et al. 2007). If 2024 PT5 is of lunar origin, 2024 PT5 could have originated from a bright highland region, as Kamo‘oalewa could be from the lunar Giordano Bruno crater (Jiao et al. 2024). The preference for the highland region is consistent with the argument from a band center analysis in Kareta et al. (2025).
The Rubin Observatory Legacy Survey of Space and Time in Chile (LSST, Ivezić et al. 2019) is expected to observe more than five million asteroids, including 100 000 NEAs, during its ten-year survey (Schwamb et al. 2023; Bolin et al. 2025c). Since there may be at least one mini-moon of 1 m diameter (not of lunar ejecta origin, but from the ΝΕΟ population) at any given time (Granvik et al. 2012), the LSST is expected to discover mini-moons as well (Bolin et al. 2014; Fedorets et al. 2020a). Preparations for follow-up observations of future mini-moon objects are thus highly encouraged, preferably in both visible and near-infrared wavelengths, as is discussed in Kareta et al. (2025).
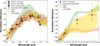 |
Fig. 12 Reflectance spectrum of 2024 PT5 and Kamo‘oalewa (Sharkey et al. 2021). Also, Mahlke templates of A- and S-type asteroids are shown (Mahlke et al. 2022). Shaded areas indicate the standard deviations of the template spectra. The lunar rock core sample colors are also shown (Isaacson et al. 2011). Shaded areas correspond to the 1σ envelope of the compiled spectra. |
5 Conclusions
We conducted visible to near-infrared multicolor photometry of 2024 PT5 with Seimei/TriCCS and Keck/MOSFIRE in January 2025. We derive color indices for 2024 PT5 of ɡ – r = 0.567 ± 0.044, r – i = 0.155 ± 0.009, r – ɀ = 0.147 ± 0.066, Y – J = 0.557 ± 0.046, J – H = 0.672 ± 0.078, and H – Ks = 0.148 ± 0.098, which indicate that 2024 PT5 is a typical S-type asteroid. Our three-day light curves are indicative of 2024 PT5 having a tumbling motion. A geometric albedo for 2024 PT5 of 0.26 ± 0.07 was derived from the slope of its photometric phase curve, which is a fairly good match to S-type and Q-type NEAs. The albedo of 2024 PT5 has not previously been reported. Using the H–G model, we derived an absolute magnitude, HV, of 27.72 ± 0.09 and a slope parameter, GV, of 0.223 ± 0.073 in the V band. The diameter of 2024 PT5 is estimated to be 7.4 ± 1.0 using the albedo and absolute magnitude. Based on the physical properties described above, our results are broadly consistent with a lunar spectral type, with similarity to other co-orbitals with lunar-like spectra such as 2020 CD3 and Kamo‘oalewa, and in agreement with existing works (Bolin et al. 2025a; Kareta et al. 2025; de la Fuente Marcos et al. 2025). This study shows that multiple observations at a wide range of phase angles using a medium-class telescope are essential to further investigate the origin of the mini-moon 2024 PT5.
Acknowledgements
We would like to thank Dr. Alessandro Morbidelli for insightful discussions and helpful comments. We thank Dr. Katsuhiro Murata for observing assistance using Seimei telescope. The authors are grateful to our reviewer Dr. Marcel Popescu for constructive comments on the manuscript. We acknowledge Dr. Robert Jedicke and Luis Langermann for the discussion regarding the steady state population of Earth’s mini-moons of lunar provenance and albedo of the Moon, respectively. J.B. thanks Dr. Theodore Kareta and Dr. Benjamin N. L. Sharkey for their constructive feedback on the spectra of 2024 PT5 and Kamo‘oalewa, respectively. J.B. is grateful to Dr. Max Mahlke for the development of, and valuable comments on, classy, a tool for exploring, downloading, analyzing, and classifying asteroid reflectance spectra. This work was supported by JSPS KAKENHI Grant Numbers JP23KJ0640 and 25H00665. This work was supported by the French government through the France 2030 investment plan managed by the National Research Agency (ANR), as part of the Initiative of Excellence Université Côte d’Azur under reference number ANR- 15-IDEX-01. Some of the data presented herein were obtained at Keck Observatory, which is a private 501(c)3 non-profit organization operated as a scientific partnership among the California Institute of Technology, the University of California, and the National Aeronautics and Space Administration. The Observatory was made possible by the generous financial support of the W. M. Keck Foundation. Keck Observatory is located on Maunakea, land of the Kānaka Maoli people, and a mountain of considerable cultural, natural, and ecological significance to the indigenous Hawaiian people. The authors wish to acknowledge the importance and reverence of Maunakea and express gratitude for the opportunity to conduct observations from the mountain. This research has made use of LTE’s Miriade VO tool.
References
- Ballouz, R. L., Agrusa, H., Barnouin, O. S., et al. 2024, PSJ, 5, 251 [Google Scholar]
- Belskaya, I. N., & Shevchenko, V. G. 2000, Icarus, 147, 94 [NASA ADS] [CrossRef] [Google Scholar]
- Beniyama, J., Ohsawa, R., Avdellidou, C., et al. 2023a, AJ, 166, 229 [NASA ADS] [CrossRef] [Google Scholar]
- Beniyama, J., Sako, S., Ohtsuka, K., et al. 2023b, ApJ, 955, 143 [NASA ADS] [CrossRef] [Google Scholar]
- Beniyama, J., Sekiguchi, T., Kuroda, D., et al. 2023c, PASJ, 75, 297 [NASA ADS] [CrossRef] [Google Scholar]
- Beniyama, J., Sergeyev, A. V., Tholen, D. J., & Micheli, M. 2024, A&A, 690, A180 [NASA ADS] [CrossRef] [EDP Sciences] [Google Scholar]
- Benson, C. J., Scheeres, D. J., & Moskovitz, N. A. 2020, Icarus, 340, 113518 [Google Scholar]
- Binzel, R. P., Morbidelli, A., Merouane, S., et al. 2010, Nature, 463, 331 [NASA ADS] [CrossRef] [Google Scholar]
- Bolin, B., Jedicke, R., Granvik, M., et al. 2014, Icarus, 241, 280 [NASA ADS] [CrossRef] [Google Scholar]
- Bolin, B. T., Fremling, C., Holt, T. R., et al. 2020, ApJ, 900, L45 [NASA ADS] [CrossRef] [Google Scholar]
- Bolin, B. T., Fernandez, Y. R., Lisse, C. M., et al. 2021, AJ, 161, 116 [Google Scholar]
- Bolin, B. T., Ahumada, T., van Dokkum, P., et al. 2022, MNRAS, 517, L49 [Google Scholar]
- Bolin, B. T., Denneau, L., Abron, L.-M., et al. 2025a, ApJ, 978, L37 [NASA ADS] [CrossRef] [Google Scholar]
- Bolin, B. T., Hanuš, J., Denneau, L., et al. 2025b, ApJ, 984, L25 [Google Scholar]
- Bolin, B. T., Masci, F. J., Coughlin, M. W., et al. 2025c, Icarus, 425, 116333 [Google Scholar]
- Bowell, E., Hapke, B., Domingue, D., et al. 1989, in Asteroids II, ed. R. P. Binzel, T. Gehrels, & M. S. Matthews (Tucson, AZ: University Arizona Press), 524 [Google Scholar]
- Carry, B., Peloton, J., Le Montagner, R., Mahlke, M., & Berthier, J. 2024, A&A, 687, A38 [NASA ADS] [CrossRef] [EDP Sciences] [Google Scholar]
- Chambers, K. C., Magnier, E. A., Metcalfe, N., et al. 2016, arXiv e-prints [arXiv:1612.05560] [Google Scholar]
- Chapman, C. R., & Morrison, D. 1976, Icarus, 28, 91 [Google Scholar]
- Daly, R. T., Ernst, C. M., Barnouin, O. S., et al. 2023, Nature, 616, 443 [CrossRef] [Google Scholar]
- de la Fuente Marcos, C., & de la Fuente Marcos, R. 2018, MNRAS, 473, 2939 [NASA ADS] [CrossRef] [Google Scholar]
- de la Fuente Marcos, C., & de la Fuente Marcos, R. 2020, MNRAS, 494, 1089 [NASA ADS] [CrossRef] [Google Scholar]
- de la Fuente Marcos, R., de León, J., de la Fuente Marcos, C., et al. 2023, A&A, 670, L10 [NASA ADS] [CrossRef] [EDP Sciences] [Google Scholar]
- de la Fuente Marcos, R., de León, J., Serra-Ricart, M., et al. 2025, A&A, 694, L5 [NASA ADS] [CrossRef] [EDP Sciences] [Google Scholar]
- de León, J., Ortiz, J. L., Pinilla-Alonso, N., et al. 2013, A&A, 555, L2 [NASA ADS] [CrossRef] [EDP Sciences] [Google Scholar]
- DeMeo, F. E., Binzel, R. P., Slivan, S. M., & Bus, S. J. 2009, Icarus, 202, 160 [Google Scholar]
- Denneau, L., Robinson, J., Fitzsimmons, A., et al. 2024, Minor Planet Electronic Circulars (USA: IAU), 2024-P170 [Google Scholar]
- Fedorets, G., Granvik, M., & Jedicke, R. 2017, Icarus, 285, 83 [Google Scholar]
- Fedorets, G., Granvik, M., Jones, R. L., Juric, M., & Jedicke, R. 2020a, Icarus, 338, 113517 [Google Scholar]
- Fedorets, G., Micheli, M., Jedicke, R., et al. 2020b, AJ, 160, 277 [NASA ADS] [CrossRef] [Google Scholar]
- Fowler, J. W., & Chillemi, J. R. 1992, Phillips Lab. Tech. Rep., 2049, 17 [Google Scholar]
- Ginsburg, A., Sipócz, B. M., Brasseur, C. E., et al. 2019, AJ, 157, 98 [NASA ADS] [CrossRef] [Google Scholar]
- Gladman, B. J., Burns, J. A., Duncan, M. J., & Levison, H. F. 1995, Icarus, 118, 302 [NASA ADS] [CrossRef] [Google Scholar]
- Glass, I. S. 1999, Handbook of Infrared Astronomy (Cambridge: Cambridge University Press) [Google Scholar]
- Granvik, M., Vaubaillon, J., & Jedicke, R. 2012, Icarus, 218, 262 [NASA ADS] [CrossRef] [Google Scholar]
- Granvik, M., Jedicke, R., Bolin, B., Chyba, M., & Patterson, G. 2013, in Asteroids: Prospective Energy and Material Resources, ed. V. Badescu (Berlin: Springer), 151 [Google Scholar]
- Harris, A. W. 1994, Icarus, 107, 209 [NASA ADS] [CrossRef] [Google Scholar]
- Hartmann, W. K., Cruikshank, D. P., & Degewij, J. 1982, Icarus, 52, 377 [Google Scholar]
- Hasselmann, P. H., Della Corte, V., Pravec, P., et al. 2024, PSJ, 5, 91 [Google Scholar]
- Hirabayashi, M., Mimasu, Y., Sakatani, N., et al. 2021, Adv. Space Res., 68, 1533 [NASA ADS] [CrossRef] [Google Scholar]
- Isaacson, P. J., Pieters, C. M., Besse, S., et al. 2011, J. Geophys. Res. Planets, 116, E00G11 [Google Scholar]
- Ishiguro, M., Abe, M., Ohba, Y., et al. 2003, PASJ, 55, 691 [Google Scholar]
- Ishiguro, M., Kuroda, D., Hasegawa, S., et al. 2014, ApJ, 792, 74 [Google Scholar]
- Ivezic, Ž., Kahn, S. M., Tyson, J. A., et al. 2019, ApJ, 873, 111 [NASA ADS] [CrossRef] [Google Scholar]
- Jackson, S. L., Rozitis, B., Dover, L. R., et al. 2022, MNRAS, 513, 3076 [NASA ADS] [CrossRef] [Google Scholar]
- Jedicke, R., Bolin, B. T., Bottke, W. F., et al. 2018, Front. Astron. Space Sci., 5, 13 [CrossRef] [Google Scholar]
- Jedicke, R., Alessi, E. M., Wiedner, N., et al. 2025, arXiv e-prints [arXiv:2504.17985] [Google Scholar]
- Jiao, Y., Cheng, B., Huang, Y., et al. 2024, Nat. Astron., 8, 819 [NASA ADS] [CrossRef] [Google Scholar]
- Kareta, T., Fuentes-Muñoz, O., Moskovitz, N., Farnocchia, D., & Sharkey, B. N. L. 2025, ApJ, 979, L8 [CrossRef] [Google Scholar]
- Kary, D. M., & Dones, L. 1996, Icarus, 121, 207 [NASA ADS] [CrossRef] [Google Scholar]
- Korokhin, V. V., Velikodsky, Y. I., Shkuratov, Y. G., & Mall, U. 2007, Sol. Syst. Res., 41, 19 [Google Scholar]
- Kurita, M., Kino, M., Iwamuro, F., et al. 2020, PASJ, 72, 48 [NASA ADS] [CrossRef] [Google Scholar]
- Kwiatkowski, T., & Kryszczynska, A. 1992, Int. Astrophys. Colloq., 30, 353 [Google Scholar]
- Kwiatkowski, T., Kryszczynska, A., Polinska, M., et al. 2009, A&A, 495, 967 [NASA ADS] [CrossRef] [EDP Sciences] [Google Scholar]
- Lang, D., Hogg, D. W., Mierle, K., Blanton, M., & Roweis, S. 2010, AJ, 139, 1782 [Google Scholar]
- Lomb, N. R. 1976, Ap&SS, 39, 447 [Google Scholar]
- Mahlke, M., Carry, B., & Mattei, P. A. 2022, A&A, 665, A26 [NASA ADS] [CrossRef] [EDP Sciences] [Google Scholar]
- Marsset, M., DeMeo, F. E., Burt, B., et al. 2022, AJ, 163, 165 [NASA ADS] [CrossRef] [Google Scholar]
- McCully, C., Crawford, S., Kovacs, G., et al. 2018, https://doi.org/10.5281/zenodo.1482019 [Google Scholar]
- McGraw, L. E., Thomas, C. A., Lister, T. A., et al. 2024, ApJ, 977, L25 [Google Scholar]
- McLean, I. S., Steidel, C. C., Epps, H. W., et al. 2012, SPIE Conf. Ser., 8446, 84460J [NASA ADS] [Google Scholar]
- Michel, P., Küppers, M., Bagatin, A. C., et al. 2022, PSJ, 3, 160 [NASA ADS] [Google Scholar]
- Mommert, M., Kelley, M., de Val-Borro, M., et al. 2019, J. Open Source Softw., 4, 1426 [NASA ADS] [CrossRef] [Google Scholar]
- Moskovitz, N. A., Benson, C. J., Scheeres, D., et al. 2020, Icarus, 340, 113519 [Google Scholar]
- Naidu, S. P., Micheli, M., Farnocchia, D., et al. 2021, ApJ, 913, L6 [NASA ADS] [CrossRef] [Google Scholar]
- Pieters, C. M. 1983, J. Geophys. Res., 88, 9534 [NASA ADS] [CrossRef] [Google Scholar]
- Popescu, M., Birlan, M., & Nedelcu, D. A. 2012, A&A, 544, A130 [NASA ADS] [CrossRef] [EDP Sciences] [Google Scholar]
- Popescu, M., Licandro, J., Morate, D., et al. 2016, A&A, 591, A115 [NASA ADS] [CrossRef] [EDP Sciences] [Google Scholar]
- Popescu, M., Licandro, J., Carvano, J. M., et al. 2018, A&A, 617, A12 [NASA ADS] [CrossRef] [EDP Sciences] [Google Scholar]
- Pravec, P., & Harris, A. W. 2007, Icarus, 190, 250 [CrossRef] [Google Scholar]
- Reddy, V., Gary, B. L., Sanchez, J. A., et al. 2015, ApJ, 811, 65 [Google Scholar]
- Reddy, V., Kelley, M. S., Farnocchia, D., et al. 2019, Icarus, 326, 133 [NASA ADS] [CrossRef] [Google Scholar]
- Rivkin, A. S., Chabot, N. L., Stickle, A. M., et al. 2021, PSJ, 2, 173 [NASA ADS] [Google Scholar]
- Scargle, J. D. 1982, ApJ, 263, 835 [Google Scholar]
- Schwamb, M. E., Jones, R. L., Yoachim, P., et al. 2023, ApJS, 266, 22 [NASA ADS] [CrossRef] [Google Scholar]
- Selmi, E., Devogèle, M., Masiero, J. R., et al. 2025, PSJ, 6, 26 [Google Scholar]
- Sergeyev, A. V., & Carry, B. 2021, A&A, 652, A59 [NASA ADS] [CrossRef] [EDP Sciences] [Google Scholar]
- Sharkey, B. N. L., Reddy, V., Malhotra, R., et al. 2021, Commun. Earth Environ., 2, 231 [NASA ADS] [CrossRef] [Google Scholar]
- Shevchenko, V. G., Belskaya, I. N., Slyusarev, I. G., et al. 2012, Icarus, 217, 202 [NASA ADS] [CrossRef] [Google Scholar]
- Shevchenko, V. G., Mikhalchenko, O. I., Belskaya, I. N., et al. 2021, Planet. Space Sci., 202, 105248 [NASA ADS] [CrossRef] [Google Scholar]
- Skrutskie, M. F., Cutri, R. M., Stiening, R., et al. 2006, AJ, 131, 1163 [NASA ADS] [CrossRef] [Google Scholar]
- Takahashi, J., Urakawa, S., Terai, T., et al. 2014, PASJ, 66, 53 [Google Scholar]
- Tonry, J. L., Stubbs, C. W., Lykke, K. R., et al. 2012, ApJ, 750, 99 [Google Scholar]
- Urakawa, S., Ohsawa, R., Sako, S., et al. 2019, AJ, 157, 155 [Google Scholar]
- van Dokkum, P. G. 2001, PASP, 113, 1420 [Google Scholar]
- VanderPlas, J. T. 2018, ApJS, 236, 16 [Google Scholar]
- Warell, J. 2004, Icarus, 167, 271 [NASA ADS] [CrossRef] [Google Scholar]
- Warner, B. D., Harris, A. W., & Pravec, P. 2009, Icarus, 202, 134 [NASA ADS] [CrossRef] [Google Scholar]
- Willmer, C. N. A. 2018, ApJS, 236, 47 [Google Scholar]
- Zappala, V., Cellino, A., Barucci, A. M., Fulchignoni, M., & Lupishko, D. F. 1990, A&A, 231, 548 [NASA ADS] [Google Scholar]
- Zhang, T., Xu, K., & Ding, X. 2021, Nat. Astron., 5, 730 [NASA ADS] [CrossRef] [Google Scholar]
In this paper, we follow the definition of, for example, Kary & Dones (1996); Granvik et al. (2012); de la Fuente Marcos et al. (2025): geocentric energy is smaller than zero, and the geocentric distance is less than three Hill radii of Earth, ~0.03 au.
In this paper, we follow the convention that the boundary between visible and near-infrared wavelengths is set at 0.75 μm (Glass 1999).
Kareta et al. (2025) observed 2024 PT5 at phase angles of ~64 deg as written in their main text, not ~1 deg as written in their Table 1.
Downloaded from the Mission Accessible Near-Earth Objects Survey (MANOS) website, https://manos.lowell.edu/
All Tables
All Figures
|
Fig. 1 Predicted magnitude (solid line) and phase angles (dashed line) of 2024 PT5 obtained from NASA JPL Horizons using the Python package astroquery (Ginsburg et al. 2019). Vertical lines show our observations and previous observations: spectrophotometry and spectroscopy in Kareta et al. (2025) (dash-dotted lines), spectroscopy and light curve observations in de la Fuente Marcos et al. (2025) (double dash-dotted lines), spectrophotometry in Bolin et al. (2025a) (dotted line), and this study (triple dash-dotted lines). |
| In the text | |
|
Fig. 2 Non-sidereally stacked images in ɡ, r, i, and ɀ bands with a total integration time of 100 s on January 4, 2024, are shown. Circles indicate 2024 PT5. The field of view covers 45 arcsec × 45 arcsec. North is to the top and east is to the left. |
| In the text | |
|
Fig. 3 Non-sidereally stacked images in Y, J, H, and K bands with a total integration time of 150 s on January 16 or 17, 2024, are shown. Circles indicate 2024 PT5. The field of view covers 45 arcsec × 45 arcsec. North is to the top and east is to the left. |
| In the text | |
|
Fig. 4 Light curves of 2024 PT5. The observed ɡ, r, i, and ɀ band magnitudes are presented as circles, triangles, squares, and diamonds, respectively. Bars indicate the 1σ uncertainties. The arithmetic average of magnitude in each light curve is presented with a dashed line. Shaded areas indicate the standard errors of the averaged magnitudes. |
| In the text | |
|
Fig. 5 Light curves of 2024 PT5 in the r band on January 4. Bars indicate the 1σ uncertainties. The variation in the light curve, 0.3 mag, is indicated. |
| In the text | |
|
Fig. 6 Lomb-Scargle periodogram of 2024 PT5. The number of harmonics of the model curve is unity. Horizontal dashed, dash-dotted, and dotted lines show 90.0, 99.0, and 99.9% confidence levels, respectively. |
| In the text | |
|
Fig. 7 Color-color diagram of (a) ɡ-r vs. r-i and (b) ɡ-r vs. r-ɀ. Means of the individual nightly mean colors of 2024 PT5 are plotted with stars. Error bars indicate the standard deviation of nightly mean colors. Error bars indicate the 1σ uncertainties. Asteroids from Sergeyev & Carry (2021) are also plotted: S-complex (circles), V-complex (triangles), X-complex (squares), K-complex (diamonds), L-complex (inverse triangles), C-complex (left-pointing triangles), B-complex (right-pointing triangles), D-complex (pentagons), and A-complex (hexagons). |
| In the text | |
|
Fig. 8 Color-color diagram of J-H vs. J-Ks. Colors of 2024 PT5 are plotted with a star. Colors of NEAs in the literature are plotted: Eros (circle) (Chapman & Morrison 1976), Itokawa (triangle) (Ishiguro et al. 2003), Apollo (square) (Hartmann et al. 1982), 2012 TC4 (diamond and inverse triangle) (Urakawa et al. 2019; Reddy et al. 2019), Wilson-Harrington (left-pointing triangle) (Hartmann et al. 1982), and Duende (right-pointing triangle and pentagon) (de Leόn et al. 2013; Takahashi et al. 2014). Error bars indicate the 1σ uncertainties. Average near-infrared colors of S, C, and X types observed by VISTA-VHS are also indicated with rectangles (Popescu et al. 2016). The colors of the lunar rock core samples of Isaacson et al. (2011) and Kamo‘oalewa of Sharkey et al. (2021) are also shown with an octagon and elongated diamond, respectively. The error bars correspond to the uncertainties of the 1σ envelope of the compiled spectra in Fig. 12. |
| In the text | |
|
Fig. 9 Phase angle dependence of reduced V magnitudes of 2024 PT5. Bars indicate the 1σ uncertainties. All magnitudes obtained on the same day are averaged and plotted, (top) The medians (50th percentile) of fitting model curves with the linear model are presented as solid lines, (bottom) The medians (50th percentile) of fitting model curves with the H–G model are presented as solid lines. Uncertainty envelopes representing the 95% highest density interval values are shown with dashed lines. |
| In the text | |
|
Fig. 10 Phase angle dependence of reduced V-band magnitudes of 2024 PT5, including corrected observations from the MPC database. (top) Magnitudes obtained on the same day from Seimei/TriCCS are averaged and plotted by circles. Data from the MPC database with reported magnitude uncertainties are shown as triangles, while the ones without reported uncertainties are represented by crosses. Bars indicate the 1σ uncertainties. The fitting model curve with the linear model is presented as a dashed line. Each data point is color-coded by the observation date, expressed as days since July 31, 2024. The figure includes an inset plot that magnifies a region including data from Seimei/TriCCS. (bottom) Same as the top panel, but the data are fit with the H–G model. |
| In the text | |
|
Fig. 11 Heliocentric positions of 2024 PT5 and Earth at the time of observations in Kareta et al. (2025), Bolin et al. (2025a), de la Fuente Marcos et al. (2025), and this study. The positions of 2024 PT5 and Earth are indicated by filled markers and open markers, respectively. The orbits of 2024 PT5 and Earth are shown with solid and dashed lines, respectively. The color of the solid line indicates the ɀ coordinate (vertical position) of 2024 PT5 in the heliocentric frame. The figure includes multiple inset plots that magnify specific regions. Although their scales differ, the aspect ratio is kept constant. |
| In the text | |
|
Fig. 12 Reflectance spectrum of 2024 PT5 and Kamo‘oalewa (Sharkey et al. 2021). Also, Mahlke templates of A- and S-type asteroids are shown (Mahlke et al. 2022). Shaded areas indicate the standard deviations of the template spectra. The lunar rock core sample colors are also shown (Isaacson et al. 2011). Shaded areas correspond to the 1σ envelope of the compiled spectra. |
| In the text | |
Current usage metrics show cumulative count of Article Views (full-text article views including HTML views, PDF and ePub downloads, according to the available data) and Abstracts Views on Vision4Press platform.
Data correspond to usage on the plateform after 2015. The current usage metrics is available 48-96 hours after online publication and is updated daily on week days.
Initial download of the metrics may take a while.