Fig. 9
Download original image
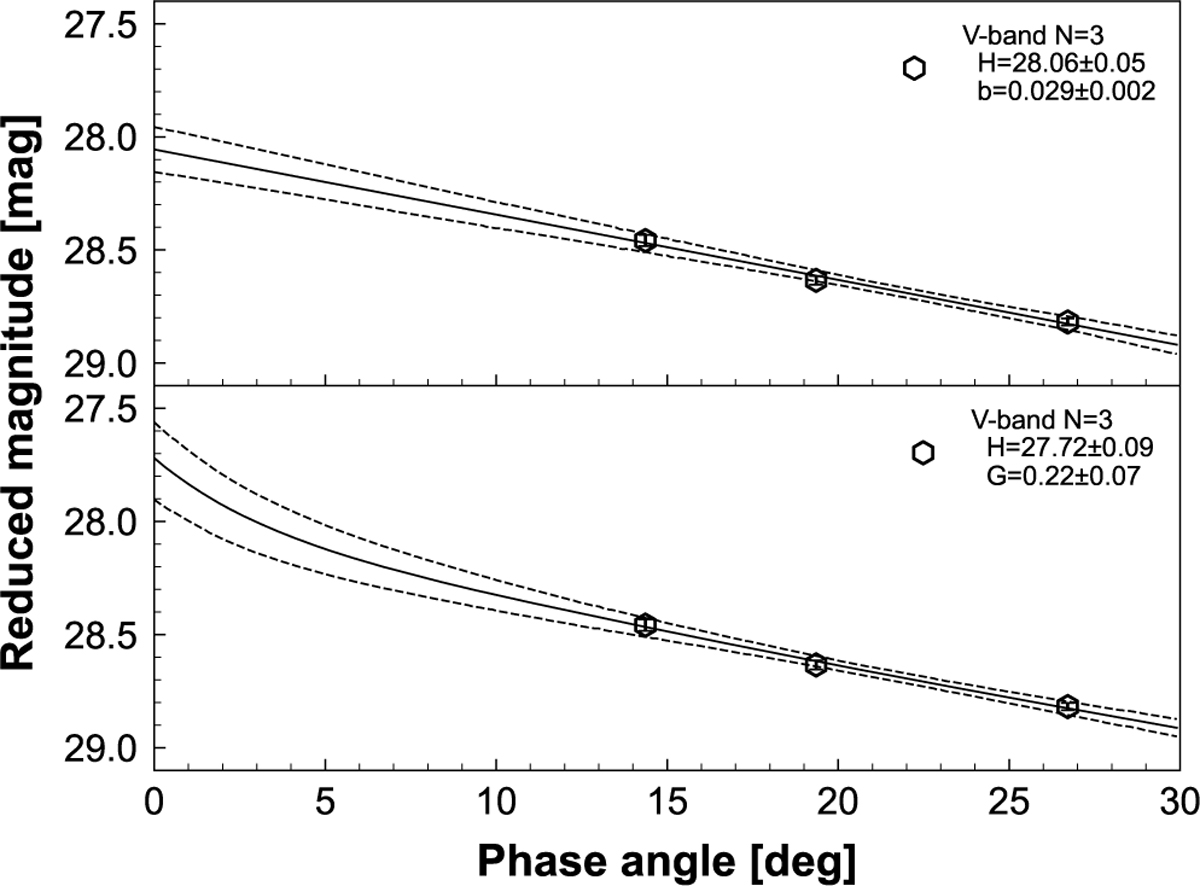
Phase angle dependence of reduced V magnitudes of 2024 PT5. Bars indicate the 1σ uncertainties. All magnitudes obtained on the same day are averaged and plotted, (top) The medians (50th percentile) of fitting model curves with the linear model are presented as solid lines, (bottom) The medians (50th percentile) of fitting model curves with the H–G model are presented as solid lines. Uncertainty envelopes representing the 95% highest density interval values are shown with dashed lines.
Current usage metrics show cumulative count of Article Views (full-text article views including HTML views, PDF and ePub downloads, according to the available data) and Abstracts Views on Vision4Press platform.
Data correspond to usage on the plateform after 2015. The current usage metrics is available 48-96 hours after online publication and is updated daily on week days.
Initial download of the metrics may take a while.