| Issue |
A&A
Volume 700, August 2025
|
|
|---|---|---|
| Article Number | A258 | |
| Number of page(s) | 4 | |
| Section | Extragalactic astronomy | |
| DOI | https://doi.org/10.1051/0004-6361/202555657 | |
| Published online | 25 August 2025 | |
The oldest tidally induced bar-like galaxy in the IllustrisTNG cluster
Nicolaus Copernicus Astronomical Center, Polish Academy of Sciences, Bartycka 18, 00-716 Warsaw, Poland
⋆ Corresponding author: This email address is being protected from spambots. You need JavaScript enabled to view it.
Received:
25
May
2025
Accepted:
29
July
2025
Abstract
New JWST observations have revealed the presence of a significant number of high-redshift barred galaxies. The origin of these bars remains unclear, and their properties appear difficult to reconcile with the results of cosmological simulations of galaxy formation. I present an example of a tidally induced bar-like galaxy formed at z = 2.9 in the TNG100 suite of the IllustrisTNG simulations. The galaxy was identified among the sample of bar-like galaxies studied before and has the earliest bar formation time among the tidally induced subsample of those objects. Its disk transformed into a bar as a result of a close interaction with a massive progenitor of a brightest cluster galaxy (BCG). It remained on a tight orbit around the host and survived until the present, losing most of its initial mass and becoming red but preserving its prolate shape. Even before the interaction, at z = 3.5, the galaxy experienced a few mergers, which elongated its shape. This temporary distortion also made it look like a bar with spiral extensions of up to 6 kpc. The long-lived bar formed later was about 3 kpc long and grew over the next few gigayears. This example demonstrates that high-z bars should not be sought among the progenitors of present-day simulated barred galaxies but rather among the tidally interacting early population of galaxies in forming groups and clusters. Some of these galaxies may have survived as ellipticals, and some may have merged with their BCGs.
Key words: galaxies: clusters: general / galaxies: evolution / galaxies: interactions / galaxies: kinematics and dynamics / galaxies: spiral / galaxies: structure
© The Authors 2025
 Open Access article, published by EDP Sciences, under the terms of the Creative Commons Attribution License (https://creativecommons.org/licenses/by/4.0), which permits unrestricted use, distribution, and reproduction in any medium, provided the original work is properly cited.
This article is published in open access under the Subscribe to Open model. This email address is being protected from spambots. You need JavaScript enabled to view it. to support open access publication.
1. Introduction
The most interesting recent discoveries made with JWST observations include the identification of well-developed barred galaxies at high redshifts (Guo et al. 2023; Costantin et al. 2023; Amvrosiadis et al. 2025). These new data also allowed unprecedented determinations of the bar fraction in the Universe at early times. It has been demonstrated that the bar fraction decreases with redshift but does not become negligible, even at z = 3 (Le Conte et al. 2024; Guo et al. 2025; Géron et al. 2025). On the theoretical side, cosmological simulations experience some difficulty in reproducing the observed dependence of bar fraction on time and in producing mature bars at such early times in cosmic evolution (Peschken & Łokas 2019; Reddish et al. 2022). Although bars can be identified inside disks even at z = 4, for example in IllustrisTNG50 (Rosas-Guevara et al. 2022), they tend to be small, not exceeding the length of 1 kpc. In the zoom-in simulations of Bi et al. (2022), the high-redshift bars were also of sub-kiloparsec lengths and gas-rich.
The bars observed at high redshifts, for example the Milky Way-like bar at z = 3 discovered by Costantin et al. (2023) with JWST or the barred spiral galaxy found at z = 4.4 by Tsukui et al. (2024) using ALMA data, both with lengths of about 3 kpc, did not necessarily evolve into anything similar to the Milky Way bar by the present time. In fact, the analysis of the evolution of the bars in the Milky Way-M31 analogues from TNG50 (Pillepich et al. 2024) shows that their bars grew mostly via disk instability from small elongations, unlike the mature bars observed by JWST. An alternative way to form a bar, and a mature one almost at once, is via interactions with other objects (Noguchi 1987; Gerin et al. 1990; Miwa & Noguchi 1998; Berentzen et al. 2004; Łokas et al. 2014, 2016; Łokas 2018). Such interactions could involve both flybys and mergers, which are much more frequent in the early stages of galaxy evolution.
In this Paper I present such a scenario for one galaxy in a sample of bar-like galaxies from the IllustrisTNG project studied in Łokas (2021). These galaxies were identified at z = 0 among sufficiently resolved and prolate systems. I studied the evolutionary histories of these galaxies and divided them into classes depending on their formation scenarios and properties. One of the classes (class A) included objects whose bar-like structures had been induced by an interaction with a more massive companion. The galaxy described here had the earliest bar formation time of this class, t = 2.2 Gyr (z = 2.9).
2. Formation and properties of the bar-like galaxy
The object of interest for this study comes from the TNG100-1 suite of simulations from the IllustrisTNG project (Springel et al. 2018; Marinacci et al. 2018; Naiman et al. 2018; Nelson et al. 2018; Pillepich et al. 2018), which follow the evolution of dark matter and baryons in a box of size 100 Mpc, solving for gravity and hydrodynamics and applying additional prescriptions for processes like star formation and feedback. The galaxy was selected from the publicly available simulation data described by Nelson et al. (2019) as a subhalo with identification number ID96556 at the last simulation output (z = 0). It was found among sufficiently massive galaxies with stellar masses M* > 1010 M⊙ and strongly prolate systems in which the intermediate-to-long axis ratio of the stellar component is b/a < 0.6. The axis ratios were estimated from the eigenvalues of the mass tensor of the stellar component included within two stellar half-mass radii, 2r1/2. Among the 277 bar-like galaxies identified in this way, 77 were found to be formed via tidal interaction with a more massive companion. This tidally induced subsample is described in more detail in Łokas (2025).
Figure 1 illustrates the evolution of different measures of the shape of the galaxy over time, with the intermediate-to-long, b/a, and short-to-long, c/a, axis ratios of the stellar component shown with the blue and red line, respectively. The green line plots the triaxiality parameter T = [1 − (b/a)2]/[1 − (c/a)2], which is below 1/3 for oblate and above 2/3 for prolate systems. The rotation parameter f (magenta line) is related to the fraction of stars on circular orbits and measures the amount of rotational support in the system (Genel et al. 2015), with f ∼ 0.4 corresponding to well-developed disks. The most important parameter for this analysis is the commonly used measure of the bar strength (Athanassoula & Misiriotis 2002) in the form of the m = 2 mode of the Fourier decomposition of the surface density distribution of stellar particles projected along the short axis. It is given by A2(R) = |Σjmjexp(2iθj)|/Σjmj, where θj is the azimuthal angle of the jth star, mj is its mass, and the sum is over all particles in a given radial bin. The single-value measurements presented here (black line) were obtained using all stars within two stellar half-mass radii, 2r1/2.
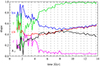 |
Fig. 1. Evolution of different measures of shape over time for galaxy ID96556. The lines show the axis ratios b/a (blue) and c/a (red), the triaxiality parameter T (green), the rotation parameter f (magenta), and the bar mode A2 (black). Vertical dashed lines indicate pericenter passages around the most massive progenitor of galaxy cluster ID96500. |
All the parameters shown in Fig. 1 indicate that at t = 2.2 Gyr (z = 2.9) the galaxy’s morphology underwent a dramatic and permanent change: the axis ratio b/a decreased and the triaxiality T and the bar mode A2 increased, signifying the formation of a bar. In particular, the latter rapidly crossed the threshold value of 0.2, which can be adopted as a signature of strong bar formation, and remained above it until the end of the evolution. The inspection of the galaxy’s environment at that time reveals that the transformation coincided with the first strong interaction with massive companions in a forming protocluster, ID96500 (marked with the first vertical dashed line in Fig. 1).
The interaction also caused a strong mass loss in the galaxy. Before the encounter, at t = 1.8 Gyr, the galaxy reached its maximum mass, 6.7 × 10¹¹ M⊙, of which 87% was dark matter, 11% was gas, and 2% was stars. Immediately after the first interaction, the galaxy started to lose dark matter and gas, though the stars continued to form as a result of a short starburst induced by the interaction. As the galaxy continued on its orbit, the gas was lost at the third pericenter passage and the stars also started to get stripped. At the end of the evolution, the mass of the galaxy was only about 2 × 10¹⁰ M⊙, half of which was dark matter and the other half was in the stellar component, and the galaxy stellar population became red.
At the time of the first interaction, t = 2.2 Gyr (z = 2.9), the protocluster contained three galaxies more massive than ID96556 (one of which was more distant and infalling). The galaxy ID96556 interacted first with the most massive of the three, which at that time had a mass of almost 7 × 10¹² M⊙, passing it at a pericenter distance of only 34 kpc on a prograde orbit (with an angle of 45 deg between the internal and orbital angular momenta just before the interaction). Soon after, it also interacted with the other two galaxies, but much more weakly. The three companions later merged to form the brightest cluster galaxy (BCG). The vertical dashed lines in Fig. 1 indicate the pericenter passages around the most massive companion and the whole BCG later on.
Interestingly, even before the first interaction, at t = 1.8 Gyr (z = 3.5) the galaxy experienced a temporary increase in the triaxiality T and the bar mode A2, as well as a decrease in the axis ratio b/a. This means that it underwent a bar-like distortion already then. The inspection of its interaction history at that time shows that it experienced a number of mergers with smaller satellites. To be precise, at t = 1.3 Gyr (z = 4.7) there were six subhalos more massive than 109 M⊙ in its vicinity that merged with it between t = 1.5 and 2.0 Gyr, including one as massive as 2 × 10¹⁰ M⊙. The mergers must have distorted the morphology, causing the elongation.
Figure 2 shows images of the stellar component of the galaxy ID96556 as it would be seen in the F444W filter of JWST in a face-on projection (along the shortest axis of the stellar component). The six panels correspond to the simulation outputs from t = 1.8 to t = 2.5 Gyr (z = 3.5 − 2.6). The upper-left image shows the elongation created by the mergers, which survived until the next snapshot (upper-middle panel) but disappeared later (upper-right panel). The lower row of panels shows the bar-like shapes created as a result of the interaction with the massive progenitor of the BCG, ID96500. This time, the bar was a permanent feature and survived until the end of the evolution. As shown in Fig. 1, at the fourth pericenter passage (t = 4.7 Gyr) the galaxy’s bar strength increased further and its rotation nearlyceased.
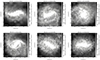 |
Fig. 2. Face-on images of the galaxy ID96556 at six subsequent simulation outputs from t = 1.8 to t = 2.5 Gyr (z = 3.5 − 2.6) as they would be observed in the F444W filter of JWST. |
Detailed properties of the bar at different stages of the evolution can be read from the profiles of the bar mode A2(R) shown in Fig. 3; the measurements were carried out in bins of ΔR = 0.5 kpc of the cylindrical radius. The profiles are plotted for different times, corresponding to the images shown in Fig. 2. For most snapshots, the profiles show a characteristic bar mode shape, which increases with radius, reaches a maximum, and then decreases. The only discrepant profile is the one at t = 2.1 Gyr (z = 3.0, green line), which increases with radius at larger distances from the galaxy center. At this time the galaxy is at the pericenter and undergoes strong tidal distortion by the more massive companion. For later outputs, the feature disappears and the bar mode returns to its normalbehavior.
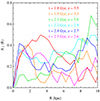 |
Fig. 3. Profiles of bar mode A2(R) for galaxy ID96556 at different times. |
The length of the bar at different stages can be estimated as the radius R at which A2(R) drops to half its maximum value. For t = 1.8 Gyr (z = 3.5, red line) the A2 profile is very extended and the bar seems to be incredibly long, on the order of 6.3 kpc. In this case, the phase of the bar mode is varying slowly with radius in the outer parts, signifying a transition to tidally induced spiral arms. In the next snapshot, at t = 1.9 Gyr (z = 3.3, orange line), its length is already much shorter, around 2.5 kpc. A bar of similar length is recreated at t = 2.4 Gyr (z = 2.7, blue line), after the interaction at the pericenter.
The whole evolution of the A2(R) profiles can be seen in Fig. 4, where they are plotted in a color-coded form as a function of time. The plot allows the evolution of both the strength and the length of the bar to be followed in detail. For example, it can be seen that after the fourth pericenter passage, at 4.7 Gyr, the bar became not only stronger, but also longer. The bar was at its strongest around 8 Gyr, and which point it started to weaken as a result of tidal stirring at multiple passages around the BCG. The redder stripes at larger radii indicate temporary elongations at the pericenters.
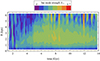 |
Fig. 4. Evolution of the profile of the bar mode A2(R) over time for galaxy ID96556. |
3. Discussion
I have presented a “proof-of-concept” example of an old bar-like galaxy formed via tidal interaction with a massive companion, a progenitor of the BCG of a forming cluster. The galaxy is unique in the sense that it was found to be the oldest among the bar-like galaxies formed this way (the second oldest appeared 1.5 Gyr later) in the TNG100-1 run of IllustrisTNG that were previously identified in the last simulation snapshot, which corresponds to the present time (Łokas 2021, 2025). This means that in spite of multiple interactions with the cluster BCG, the object survived until the present.
This channel of the formation of high-redshift bars seems probable since tidal interactions as well as mergers occur more frequently at the early stages of galaxy evolution. It is even possible that high-z bars preferentially form via tidal interactions, also because the galactic disks are then hotter, more gas-rich, and more turbulent, which makes the onset of the inherent bar instability more difficult. In fact, many of the high-z bars studied by Guo et al. (2023, 2025) turn out to have companions. In particular, at z > 1.5 the percentage of barred galaxies with companions appears to be much higher than for unbarred disks.
The configuration in which the bar was induced in the galaxy studied here is to some extent similar to the one found by Smail et al. (2023) for their observed barred galaxy at z > 4. The real object also seems to belong to a group of galaxies, although in their case it is the main galaxy that appears to have a bar-like feature. If this structure is of tidal origin, it must have been induced by a smaller companion or mergers.
The simulated bar-like galaxy presented here may be exceptional in the sense that it survived until the present time. At present, however, it would not look like a typical barred galaxy with a bar embedded in a disk. It would rather appear as a red, weakly rotating elliptical, although quite elongated. This suggests that one should not look for early bars in simulations among the progenitors of present-day barred disks or Milky Way-M31 analogues (Rosas-Guevara et al. 2022; Pillepich et al. 2024). Most of these galaxies seem to have formed their bars during a long, secular evolution via dynamical instability of cold enough, massive disks, and grew their bars gradually, from a very low initial strength and a short length.
In this study, I used the TNG100 simulation of the IllustrisTNG suite, which has a larger simulation box at the cost of a lower resolution compared to TNG50. This results in the smaller bars not being resolved in TNG100 (unlike in TNG50) and the impression that TNG50 produces overall smaller bars. This should not be an issue since in this work I am interested in long bars seen by JWST, and those should be resolved in TNG100. Instead, finding configurations similar to the one studied here can be problematic in TNG50 because this simulation contains only one massive galaxy cluster. Indeed, as discussed in Łokas (2024), one can find significantly fewer bar-like galaxies in TNG50 than expected.
As mentioned above, flybys and mergers in controlled as well as cosmological simulations tend to produce long, mature bars soon after the interaction (Łokas 2018, 2022) rather than grow them from small perturbations. This is confirmed by the recent study of bars in the suite of Auriga simulations of Milky Way-like galaxies by Fragkoudi et al. (2025), who find that bars formed at higher redshifts (up to z = 2) tend to be born long via interactions, while those forming later start shorter and grow in time. On the other hand, using high-resolution zoom-in simulations of disk galaxies, Bi et al. (2022) found them to have only short, sub-kiloparsec bars at high redshifts in spite of the fact that all their bars at z > 2 formed via interactions. This difference can be traced to the specific setup of their simulations, which did not include active galactic nucleus feedback. The lack of this feature is known to prevent or slow the formation of bars because of the strong accumulation of gas in the galaxy center (Athanassoula et al. 2016; Bonoli et al. 2016; Rosas-Guevara et al. 2025). This interpretation is supported by the fact that the small early bars of Bi et al. (2022) are very gas-rich.
Further examples of early bars in cosmological simulations can be identified by studying interactions and mergers at early times. Many such bars do not survive until the present, not only in terms of morphology but even as separate galaxies. An example of such an occurrence is provided by the very configuration studied here. One of the massive members in the ID96500 group also had a bar induced as a result of an interaction with the most massive progenitor of this BCG. However, neither the bar nor the galaxy survived because the latter soon merged with the BCG. Such examples of sizable bar-like galaxies formed early via interactions in IllustrisTNG will be discussed in detail in a follow-up paper.
Acknowledgments
I am grateful to the anonymous referee for useful comments and to the IllustrisTNG team for making their simulations publicly available. Computations for this work have been performed using the computer cluster at the Nicolaus Copernicus Astronomical Center of the Polish Academy of Sciences (CAMK PAN).
References
- Amvrosiadis, A., Lange, S., Nightingale, J. W., et al. 2025, MNRAS, 537, 1163 [Google Scholar]
- Athanassoula, E., & Misiriotis, A. 2002, MNRAS, 330, 35 [Google Scholar]
- Athanassoula, E., Rodionov, S. A., Peschken, N., & Lambert, J. C. 2016, ApJ, 821, 90 [NASA ADS] [CrossRef] [Google Scholar]
- Berentzen, I., Athanassoula, E., Heller, C. H., & Fricke, K. J. 2004, MNRAS, 347, 220 [Google Scholar]
- Bi, D., Shlosman, I., & Romano-Díaz, E. 2022, ApJ, 934, 52 [NASA ADS] [CrossRef] [Google Scholar]
- Bonoli, S., Mayer, L., Kazantzidis, S., et al. 2016, MNRAS, 459, 2603 [NASA ADS] [CrossRef] [Google Scholar]
- Costantin, L., Pérez-González, P. G., Guo, Y., et al. 2023, Nature, 623, 499 [NASA ADS] [CrossRef] [Google Scholar]
- Fragkoudi, F., Grand, R. J. J., Pakmor, R., et al. 2025, MNRAS, 538, 1587 [Google Scholar]
- Genel, S., Fall, S. M., Hernquist, L., et al. 2015, ApJ, 804, L40 [NASA ADS] [CrossRef] [Google Scholar]
- Gerin, M., Combes, F., & Athanassoula, E. 1990, A&A, 230, 37 [NASA ADS] [Google Scholar]
- Géron, T., Smethurst, R. J., Dickinson, H., et al. 2025, ApJ, 987, 74 [Google Scholar]
- Guo, Y., Jogee, S., Finkelstein, S. L., et al. 2023, ApJ, 945, L10 [NASA ADS] [CrossRef] [Google Scholar]
- Guo, Y., Jogee, S., Wise, E., et al. 2025, ApJ, 985, 181 [Google Scholar]
- Le Conte, Z. A., Gadotti, D. A., Ferreira, L., et al. 2024, MNRAS, 530, 1984 [NASA ADS] [CrossRef] [Google Scholar]
- Łokas, E. L. 2018, ApJ, 857, 6 [Google Scholar]
- Łokas, E. L. 2021, A&A, 647, A143 [NASA ADS] [CrossRef] [EDP Sciences] [Google Scholar]
- Łokas, E. L. 2022, A&A, 668, L3 [NASA ADS] [CrossRef] [EDP Sciences] [Google Scholar]
- Łokas, E. L. 2024, A&A, 687, A82 [NASA ADS] [CrossRef] [EDP Sciences] [Google Scholar]
- Łokas, E. L. 2025, A&A, submitted [Google Scholar]
- Łokas, E. L., Athanassoula, E., Debattista, V. P., et al. 2014, MNRAS, 445, 1339 [Google Scholar]
- Łokas, E. L., Ebrová, I., del Pino, A., et al. 2016, ApJ, 826, 227 [Google Scholar]
- Marinacci, F., Vogelsberger, M., Pakmor, R., et al. 2018, MNRAS, 480, 5113 [NASA ADS] [Google Scholar]
- Miwa, T., & Noguchi, M. 1998, ApJ, 499, 149 [Google Scholar]
- Naiman, J. P., Pillepich, A., Springel, V., et al. 2018, MNRAS, 477, 1206 [Google Scholar]
- Nelson, D., Pillepich, A., Springel, V., et al. 2018, MNRAS, 475, 624 [Google Scholar]
- Nelson, D., Springel, V., Pillepich, A., et al. 2019, Comput. Astrophys. Cosmol., 6, 2 [Google Scholar]
- Noguchi, M. 1987, MNRAS, 228, 635 [NASA ADS] [Google Scholar]
- Peschken, N., & Łokas, E. L. 2019, MNRAS, 483, 2721 [Google Scholar]
- Pillepich, A., Nelson, D., Hernquist, L., et al. 2018, MNRAS, 475, 648 [Google Scholar]
- Pillepich, A., Sotillo-Ramos, D., Ramesh, R., et al. 2024, MNRAS, 535, 1721 [NASA ADS] [CrossRef] [Google Scholar]
- Reddish, J., Kraljic, K., Petersen, M. S., et al. 2022, MNRAS, 512, 160 [NASA ADS] [CrossRef] [Google Scholar]
- Rosas-Guevara, Y., Bonoli, S., Dotti, M., et al. 2022, MNRAS, 512, 5339 [NASA ADS] [CrossRef] [Google Scholar]
- Rosas-Guevara, Y., Bonoli, S., Puchwein, E., Dotti, M., & Contreras, S. 2025, A&A, 698, A20 [NASA ADS] [CrossRef] [EDP Sciences] [Google Scholar]
- Smail, I., Dudzevičiūtė, U., Gurwell, M., et al. 2023, ApJ, 958, 36 [NASA ADS] [CrossRef] [Google Scholar]
- Springel, V., Pakmor, R., Pillepich, A., et al. 2018, MNRAS, 475, 676 [Google Scholar]
- Tsukui, T., Wisnioski, E., Bland-Hawthorn, J., et al. 2024, MNRAS, 527, 8941 [Google Scholar]
All Figures
|
Fig. 1. Evolution of different measures of shape over time for galaxy ID96556. The lines show the axis ratios b/a (blue) and c/a (red), the triaxiality parameter T (green), the rotation parameter f (magenta), and the bar mode A2 (black). Vertical dashed lines indicate pericenter passages around the most massive progenitor of galaxy cluster ID96500. |
| In the text | |
|
Fig. 2. Face-on images of the galaxy ID96556 at six subsequent simulation outputs from t = 1.8 to t = 2.5 Gyr (z = 3.5 − 2.6) as they would be observed in the F444W filter of JWST. |
| In the text | |
|
Fig. 3. Profiles of bar mode A2(R) for galaxy ID96556 at different times. |
| In the text | |
|
Fig. 4. Evolution of the profile of the bar mode A2(R) over time for galaxy ID96556. |
| In the text | |
Current usage metrics show cumulative count of Article Views (full-text article views including HTML views, PDF and ePub downloads, according to the available data) and Abstracts Views on Vision4Press platform.
Data correspond to usage on the plateform after 2015. The current usage metrics is available 48-96 hours after online publication and is updated daily on week days.
Initial download of the metrics may take a while.