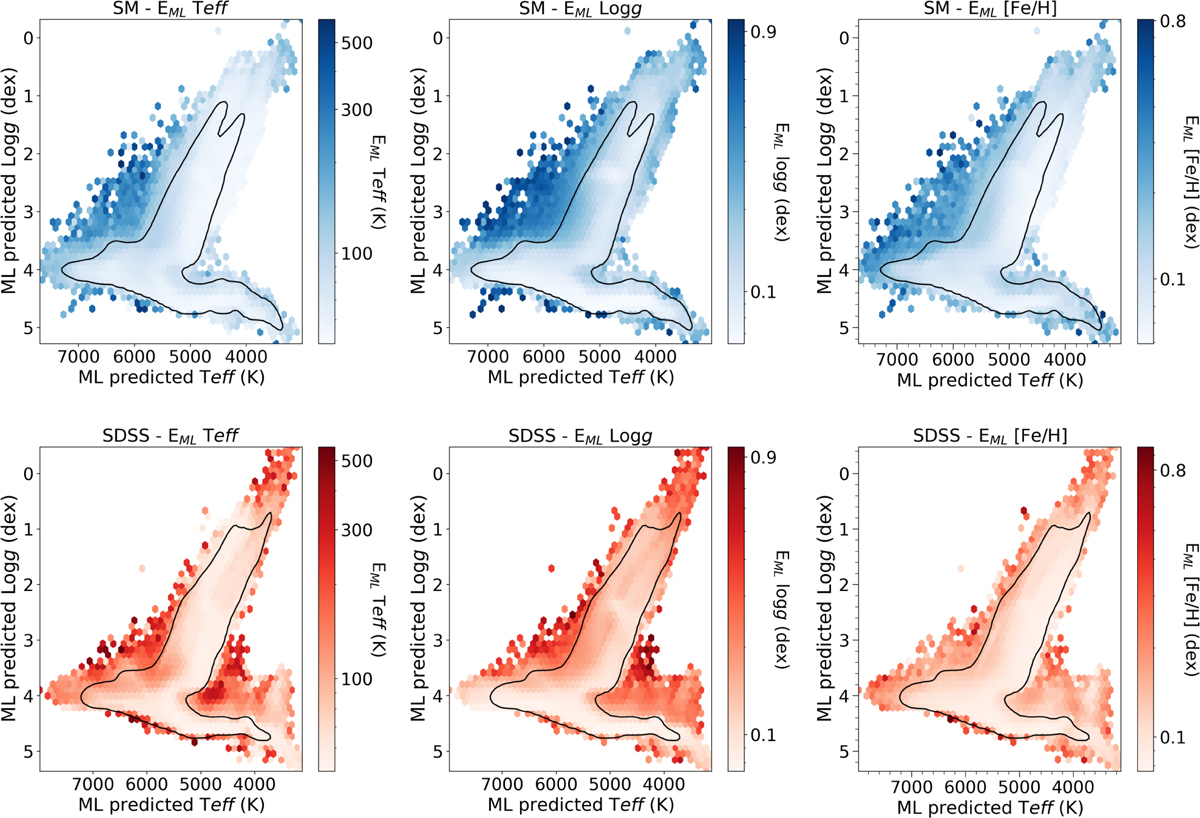
Fig. B.1
Download original image
Kiel Diagram for the SM (above) and SDSS (below) full sample, colored with the estimated errors on the three parameters. From left to right: Teff, log ɡ, and [Fe/H]. Hexagonal bins are colored based on the average of the errors inside the bin. The black line approximately encloses the region covered by the respective “train_area” flags described in Sect. 5.2.
Current usage metrics show cumulative count of Article Views (full-text article views including HTML views, PDF and ePub downloads, according to the available data) and Abstracts Views on Vision4Press platform.
Data correspond to usage on the plateform after 2015. The current usage metrics is available 48-96 hours after online publication and is updated daily on week days.
Initial download of the metrics may take a while.