Fig. C.1
Download original image
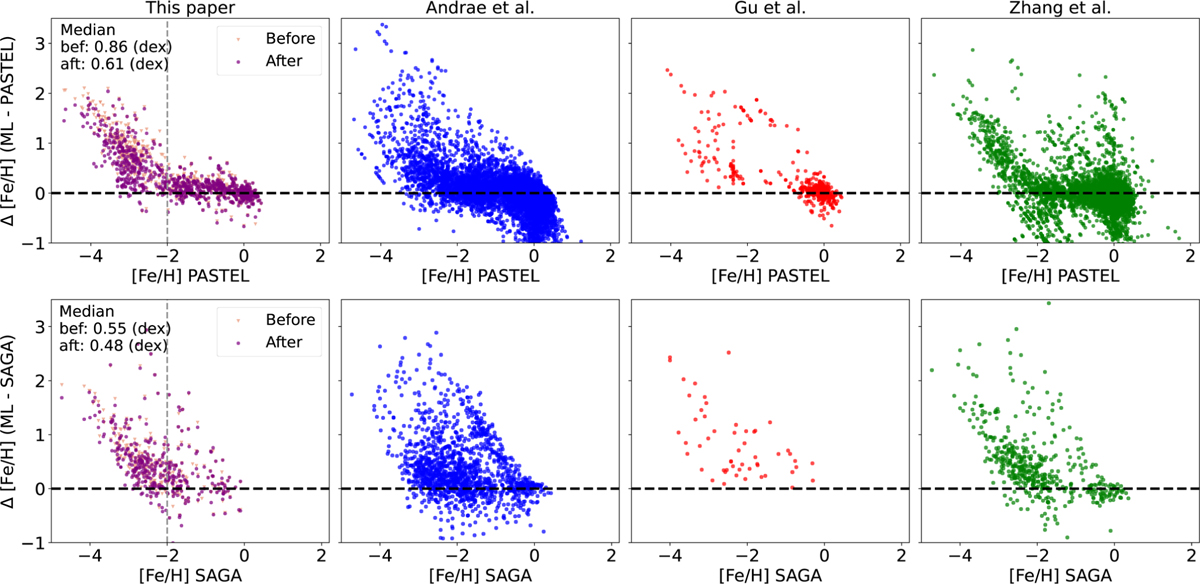
Comparison of the [Fe/H] predicted by this work and by three literature ML catalogs with the PASTEL (top row) and SAGA (bottom row) databases. Our results are shown in the leftmost plots, where the grey points show the results before, and the purple ones after, augmenting the reference SoS-Spectro catalog with very metal-poor stars. The median [Fe/H] differences for the before and after augmentation samples (computed only for [Fe/H] < −2) are indicated in the top-left corner of the first plot in each row. A similar comparison is presented for the following catalogs: Andrae et al. (2023, blue, center-left panels), Gu et al. (2025, red, center-right panels), and Zhang et al. (2023, green, rightmost panels).
Current usage metrics show cumulative count of Article Views (full-text article views including HTML views, PDF and ePub downloads, according to the available data) and Abstracts Views on Vision4Press platform.
Data correspond to usage on the plateform after 2015. The current usage metrics is available 48-96 hours after online publication and is updated daily on week days.
Initial download of the metrics may take a while.