Open Access
Fig. C.3
Download original image
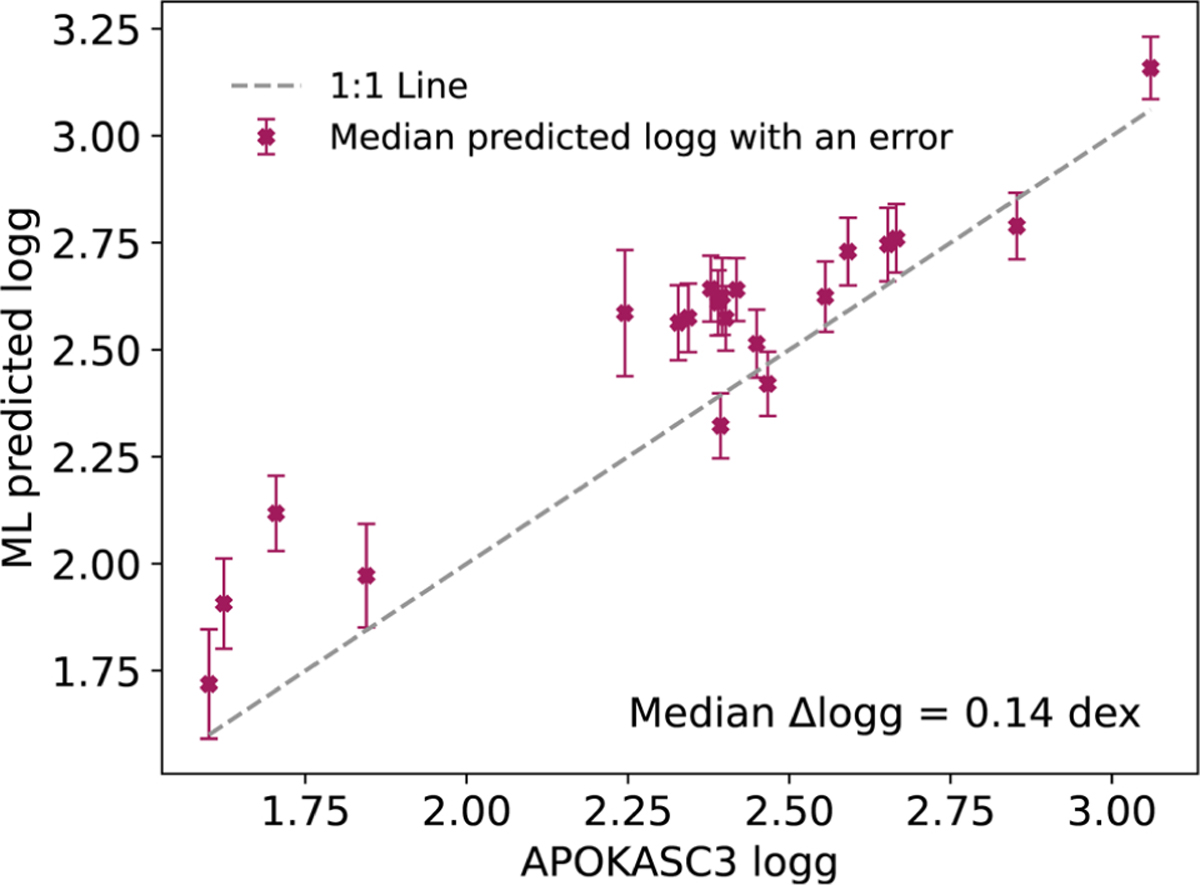
Comparison of surface gravity log g values by APOKASC-3 with those predicted using machine learning in this study. The error bars represent the uncertainties in our predictions.
Current usage metrics show cumulative count of Article Views (full-text article views including HTML views, PDF and ePub downloads, according to the available data) and Abstracts Views on Vision4Press platform.
Data correspond to usage on the plateform after 2015. The current usage metrics is available 48-96 hours after online publication and is updated daily on week days.
Initial download of the metrics may take a while.