Open Access
Fig. 6
Download original image
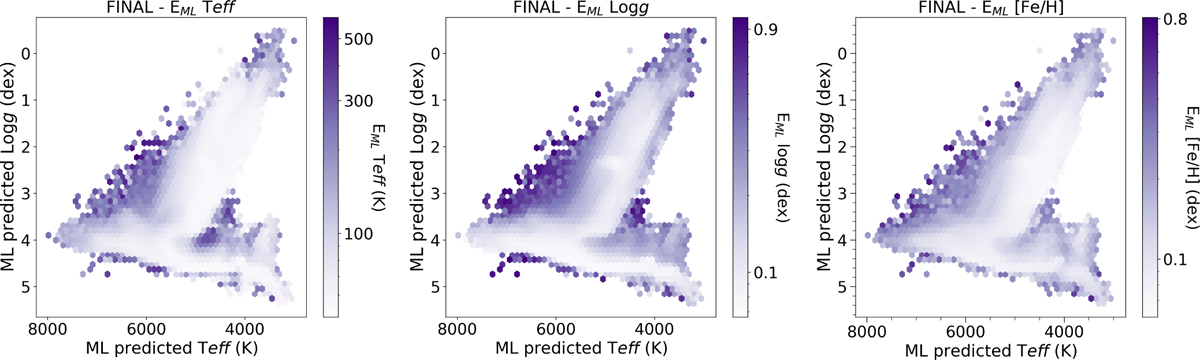
Kiel diagram for the final catalog, colored with the estimated errors on the three parameters. From left to right: Teff, log ɡ, and [Fe/H]. The diagram is divided into small hexagonal bins, and the color represents the average of the error inside the bin.
Current usage metrics show cumulative count of Article Views (full-text article views including HTML views, PDF and ePub downloads, according to the available data) and Abstracts Views on Vision4Press platform.
Data correspond to usage on the plateform after 2015. The current usage metrics is available 48-96 hours after online publication and is updated daily on week days.
Initial download of the metrics may take a while.