Fig. 7
Download original image
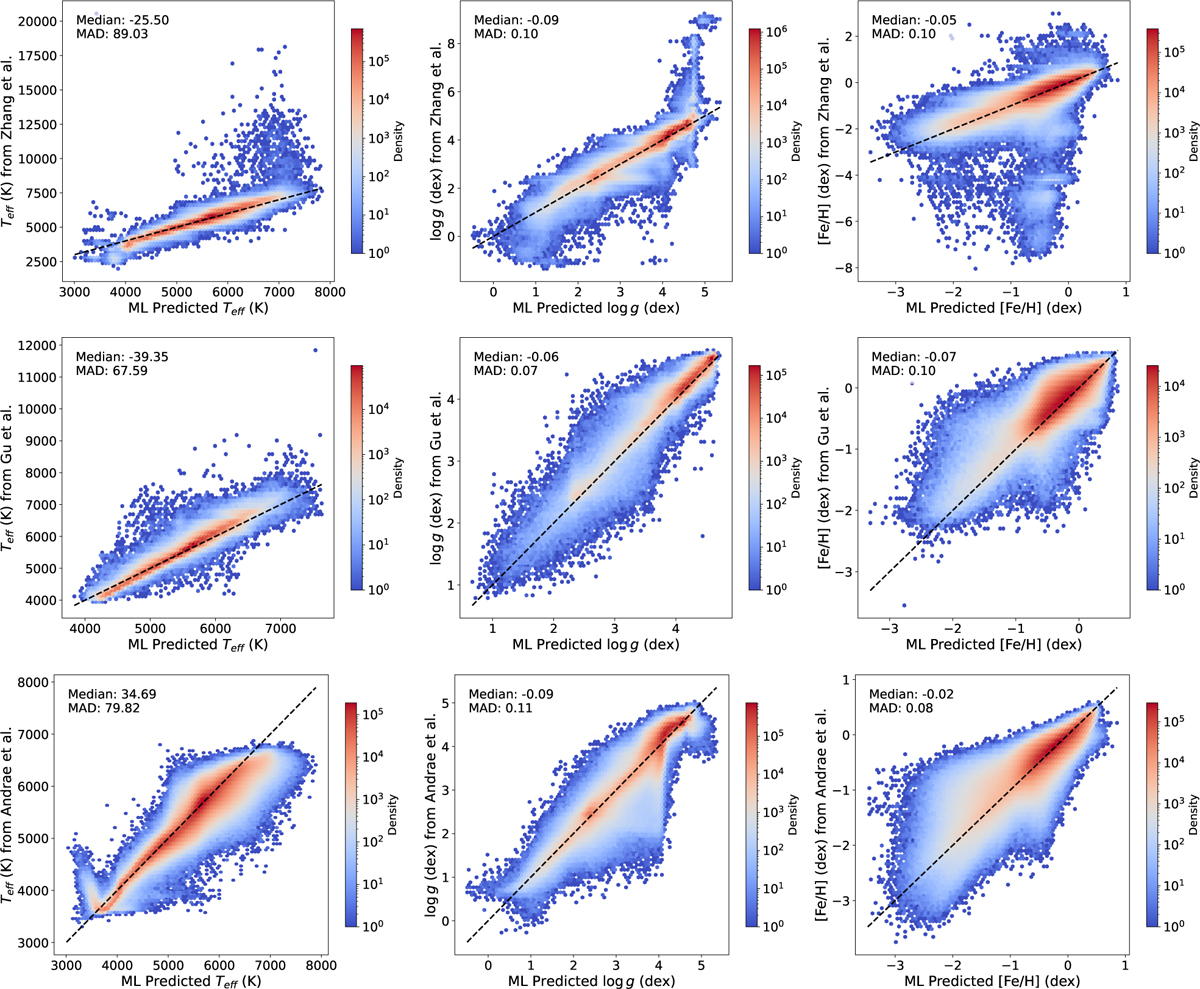
Comparison of the atmospheric parameters predicted by our ML approach (abscissae) and literature ML catalogs (ordinates). The left plots show Teff comparisons, the middle plots show log g, and the right plots show [Fe/H], The top row shows the comparison with Zhang et al. (2023). the middle row shows the comparison with Gu et al. (2025), and the bottom row shows the comparison with Andrae et al. (2023). The dashed line represents the 1:1 relation.
Current usage metrics show cumulative count of Article Views (full-text article views including HTML views, PDF and ePub downloads, according to the available data) and Abstracts Views on Vision4Press platform.
Data correspond to usage on the plateform after 2015. The current usage metrics is available 48-96 hours after online publication and is updated daily on week days.
Initial download of the metrics may take a while.