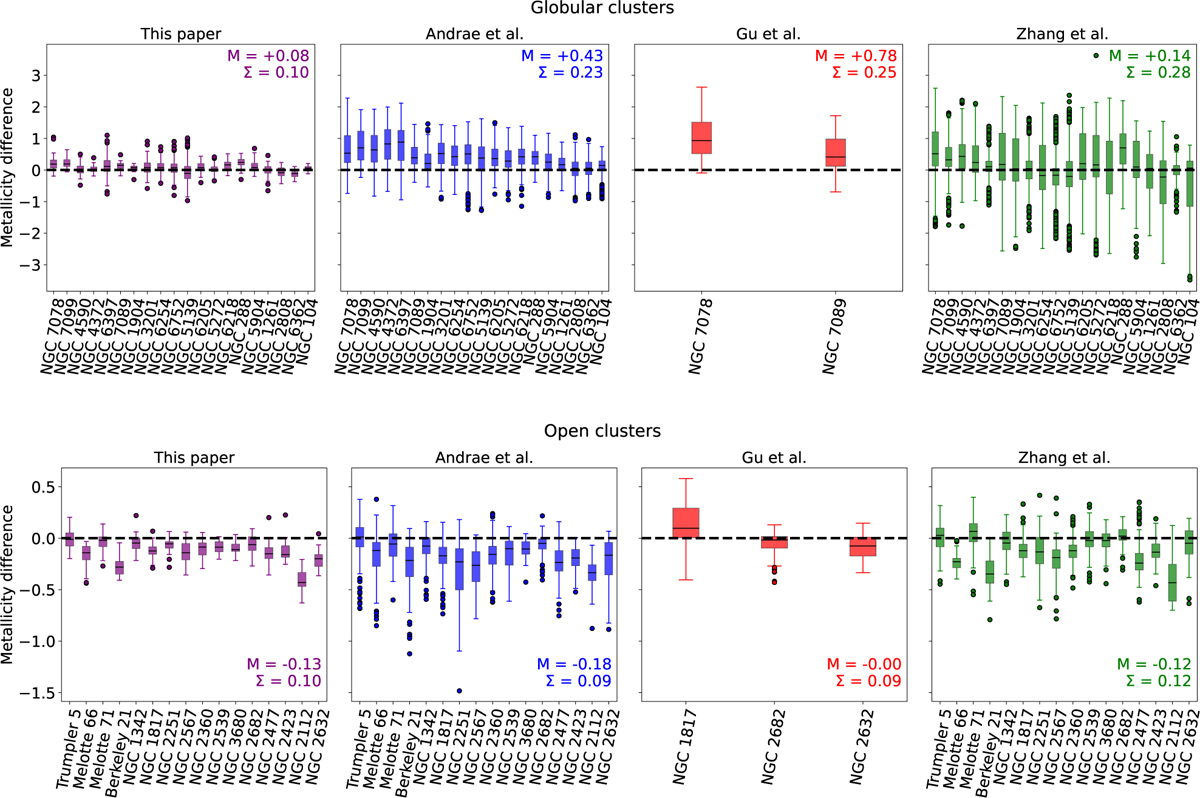
Fig. 8
Download original image
Comparison of metallicity predictions for globular (top row) and open clusters (bottom row). Our results are shown in purple in the leftmost panels, the results by Andrae et al. (2023) are plotted in blue in the center left panels, the results by Gu et al. (2025) are shown in red in the center right panels, and the results by Zhang et al. (2023) are shown in green in the rightmost panels. The boxplots show the metallicity differences with respect to the values reported by Harris (1996) and Netopil et al. (2016) for selected clusters. The boxes represent the interquartile range (IQR), the central lines the median, and the whiskers extend to 1.5 times the IQR. Outliers are marked as individual points. The mean metallicity difference (M) and standard deviation (Σ) are annotated in each panel. The dashed line at zero indicates perfect agreement with the literature values (zero-line). Clusters are sorted by ascending metallicity.
Current usage metrics show cumulative count of Article Views (full-text article views including HTML views, PDF and ePub downloads, according to the available data) and Abstracts Views on Vision4Press platform.
Data correspond to usage on the plateform after 2015. The current usage metrics is available 48-96 hours after online publication and is updated daily on week days.
Initial download of the metrics may take a while.