Open Access
Fig. 2
Download original image
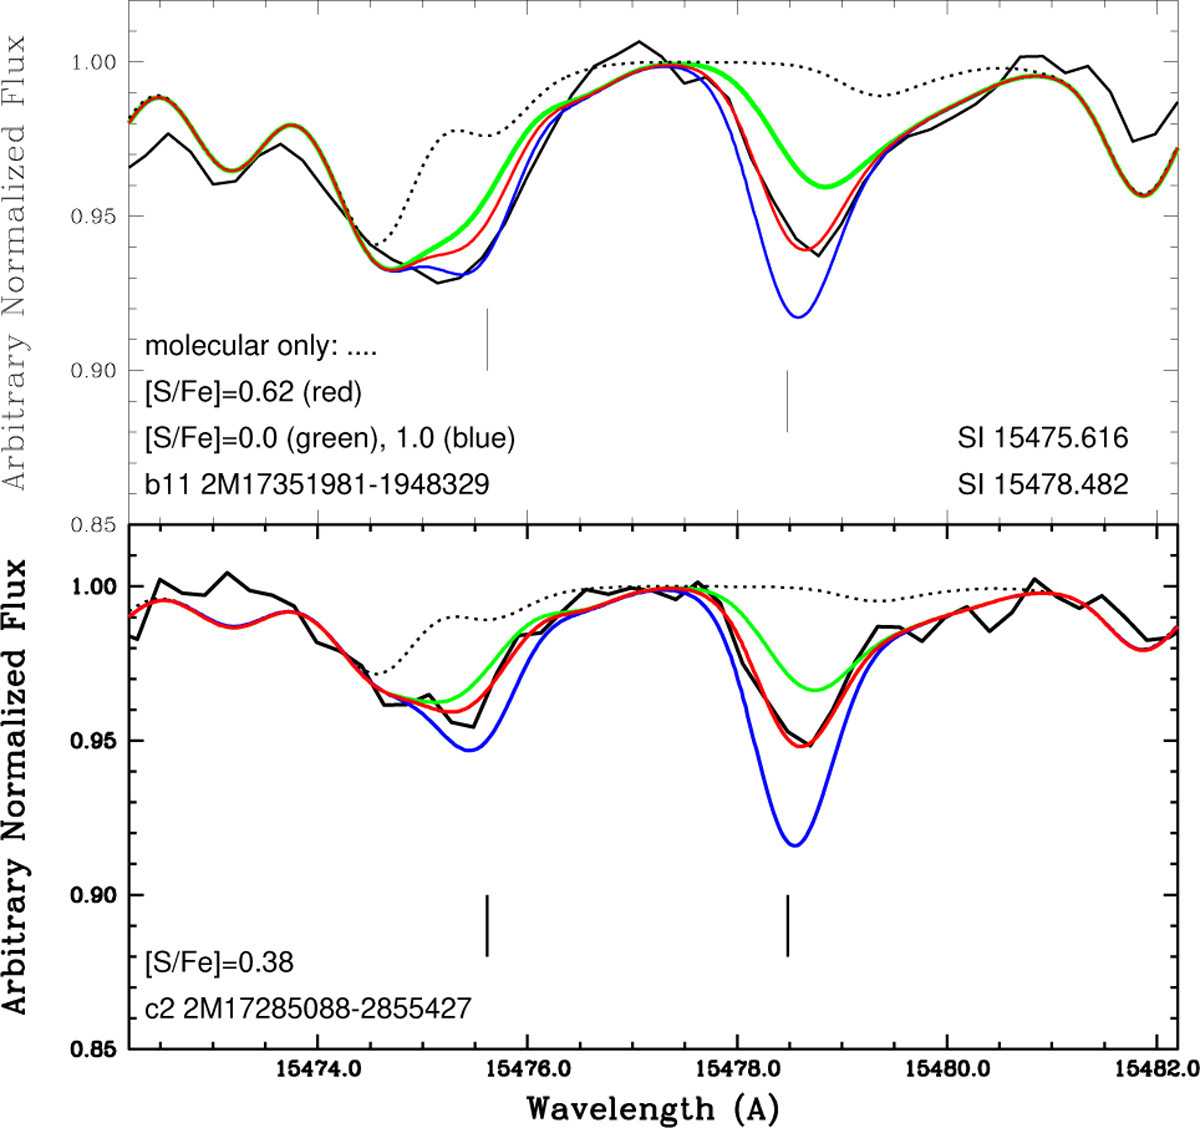
S I 15475.624 and 15478.496 Å lines in stars b11 2M17351981-1948329 and c2 2M17285088-2855427. Observed spectra (black) are compared with synthetic spectra computed with [S/Fe] = 0.0 (green), 1.0 (blue), and final values (red). Dotted lines correspond to molecular lines only.
Current usage metrics show cumulative count of Article Views (full-text article views including HTML views, PDF and ePub downloads, according to the available data) and Abstracts Views on Vision4Press platform.
Data correspond to usage on the plateform after 2015. The current usage metrics is available 48-96 hours after online publication and is updated daily on week days.
Initial download of the metrics may take a while.