| Issue |
A&A
Volume 700, August 2025
|
|
|---|---|---|
| Article Number | A184 | |
| Number of page(s) | 10 | |
| Section | Galactic structure, stellar clusters and populations | |
| DOI | https://doi.org/10.1051/0004-6361/202555713 | |
| Published online | 15 August 2025 | |
Abundances of P, S, and K in 58 bulge spheroid stars from APOGEE
1
Universidade de São Paulo, IAG, Departamento de Astronomia,
05508-090
São Paulo,
Brazil
2
Lund Observatory, Department of Astronomy and Theoretical Physics, Lund University,
Box 43,
221 00
Lund,
Sweden
3
Max Planck Institute for Astronomy,
Königstuhl 17,
69117
Heidelberg,
Germany
4
Instituto de Astrofísica de Canarias,
C/Via Lactea s/n,
38205
La Laguna,
Tenerife,
Spain
5
Departamento de Astrofísica, Universidad de La Laguna,
38206
La Laguna,
Tenerife,
Spain
6
Instituto de Astronomía, Universidad Católica del Norte,
Av. Angamos 0610,
Antofagasta,
Chile
7
University of Arizona, Steward Observatory,
Tucson,
AZ
85719,
USA
8
Observatório Nacional, rua General José Cristino 77,
São Cristóvão, Rio de Janeiro
20921-400,
Brazil
9
NSF NOIRLab,
950 N. Cherry Ave.,
Tucson,
AZ
85719,
USA
10
Instituto de Astronomía, Universidad Nacional Autónoma de México,
A. P. 106,
C.P. 22800,
Ensenada,
B. C.,
Mexico
11
Astrophysikalisches Institut Potsdam,
An der Sternwarte 16,
Potsdam,
14482,
Germany
12
Universidade Federal do Rio Grande do Sul,
Caixa Postal 15051,
91501-970
Porto Alegre,
Brazil
13
Department of Physics and Astronomy and JINA Center for the Evolution of the Elements (JINA-CEE), University of Notre Dame,
Notre Dame,
IN
46556,
USA
14
Departament de Física Quãntica i Astrofísica (FQA), Universitat de Barcelona (UB),
Martí i Franquès, 1,
08028
Barcelona,
Spain
15
Institut de Ciències del Cosmos, Universitat de Barcelona (IEEC-UB),
Martí i Franquès 1,
08028
Barcelona,
Spain
16
Institut d’Estudis Espacials de Catalunya (IEEC), Edifici RDIT, Campus UPC,
08860
Castelldefels (Barcelona),
Spain
17
Astrophysics Research Institute, Liverpool John Moores University,
Liverpool
L3 5RF,
UK
18
Instituto de Astrofísica, Facultad de Ciencias Exactas, Universidad Andres Bello,
Fernández Concha 700,
Las Condes,
Santiago,
Chile
19
Vatican Observatory,
Vatican City State
00120,
Italy
20
Departamento de Astronomía, Casilla 160-C, Universidad de Concepción,
Chile
21
Departamento de Astronomía, Facultad de Ciencias, Universidad de La Serena.
Av. Avenida Raúl Bitrán S/N,
La Serena,
Chile
22
Universidade Federal de Sergipe,
Av. Marechal Rondon, S/N,
49000-000
São Cristóvão,
SE,
Brazil
23
Instituto de Astrofísica, Pontificia Universidad Católica de Chile,
Vicuña Mackenna
4860,
Macul, Casilla 306, Santiago 22,
Chile
24
Université Côte d’Azur, Observatoire de la Côte d’Azur, CNRS, Laboratoire Lagrange,
Nice,
France
25
Centro de Astronomía (CITEVA), Universidad de Antofagasta,
Avenida Angamos 601,
Antofagasta
1270300,
Chile
★ Corresponding author.
Received:
28
May
2025
Accepted:
14
July
2025
Abstract
Context. We have previously studied several elements in 58 selected bulge spheroid stars, based on spectral lines in the H band. We now derive the abundances of the less studied elements phosphorus (P; Z=15), sulphur (S; Z=16), and potassium (K; Z=19).
Aims. The abundances of P, S, and K in 58 bulge spheroid stars are compared both with the results of a previous analysis of the data from the Apache Point Observatory Galactic Evolution Experiment (APOGEE), and with a few available studies of these elements.
Methods. We derived the individual abundances through spectral synthesis, using the stellar physical parameters available for our sample from the DR17 release of the APOGEE project. We provide recommendations for the best lines to be used for the studied elements among those in the H-band. We also compare the present results, together with literature data, with chemical-evolution models. Finally, the neutrino-process was taken into account for the suitable fit to the odd-Z elements P and K.
Results. We confirm that the H-band has useful lines for the derivation of the elements P, S, and K in moderately metal-poor stars. The abundances, plotted together with literature results from high-resolution spectroscopy, indicate that moderately enhanced phosphorus stars are found, reminiscent of results obtained for thick disc and halo stars of metallicity [Fe/H]≈−1.0. Therefore, for the first time, we identify that this effect occurs in the old stars from the bulge spheroid. Sulphur is an α-element and behaves as such. Potassium and sulphur both exhibit some star-to-star scatter, but fit within the expectations of chemical evolution models.
Key words: stars: abundances / stars: atmospheres / Galaxy: bulge
© The Authors 2025
 Open Access article, published by EDP Sciences, under the terms of the Creative Commons Attribution License (https://creativecommons.org/licenses/by/4.0), which permits unrestricted use, distribution, and reproduction in any medium, provided the original work is properly cited.
This article is published in open access under the Subscribe to Open model. This email address is being protected from spambots. You need JavaScript enabled to view it. to support open access publication.
1 Introduction
Galaxy bulges and inner haloes form first (e.g. Gao et al. 2010); the oldest stars in the Milky Way were very likely formed in the early bulge. We have identified a sample of 58 stars that appear to represent the stellar population of an early bulge spheroid, based on chemical, kinematical, and dynamical criteria, as described in Razera et al. (2022). These old bulge stars were selected to have metallicities of [Fe/H] < −0.8, in order to exclude most of the bulge stars that are metal-rich and include stars from a small metallicity peak at [Fe/H] ~ −1.0 that is detected in both bulge globular clusters (Rossi et al. 2015; Bica et al. 2016; Pérez-Villegas et al. 2020; Bica et al. 2024) and field stars (Lucey et al. 2021). This relatively high metallicity for the oldest stars is due to rapid chemical enrichment in the central region of the Galaxy (Chiappini et al. 2011; Wise et al. 2012; Friaça & Barbuy 2017; Barbuy et al. 2018a; Matteucci 2021). There is some evidence that many of the stars located in the bulge with a metallicity of [Fe/H] ≲−1.5 should be assigned to a halo origin, as is discussed in Lucey et al. (2021), and also suggested by Fernández-Trincado et al. (2020) and Geisler et al. (2023) as concerns the bulge globular clusters.
The kinematical characteristics of the sample stars, together with analysed abundances of C, N, O, Mg, Si, Ca, and Ce, are reported in Razera et al. (2022). Barbuy et al. (2023) and Barbuy et al. (2024) derived Na and Al, and iron-peak elements V, Cr, Mn, Co, Ni, and Cu, respectively, and interpreted these abundances in terms of their chemical-evolution models. In Sales-Silva et al. (2024) the neutron-capture elements Nd and Ce, including some stars in common with the present sample, were analysed. In this paper, we analyse the less studied elements P, S, and K. These studies are based on data from the Apache Point Observatory Galactic Evolution Experiment (APOGEE; Majewski et al. 2017).
The elements P, S, and K are produced in type II supernovae, also called core-collapse supernovae (CCSNe) (e.g. Woosley & Weaver 1995, hereafter WW95). The chemical evolution models of Cescutti et al. (2012) succeeded in reproducing P in disc star data by using the massive star yields of Kobayashi et al. (2006) multiplied by a factor of 2.75. Based on data for halo stars, Jacobson et al. (2014) favoured the yields from hypernovae (HNe) by Kobayashi et al. (2006) to reproduce their data. These elements were little studied in the literature, primarily because they possess only a few measurable and unblended spectral lines in the optical. For phosphorus, the H-band shows one measurable line and a second fainter line. Sulphur has lines in the region 600–900 nm that are non-negligibly affected by NLTE, and one measurable line in the H band. Potassium has two lines in the H band, both only blended with rather weak CN features. In the present work we derive the abundances of these elements using spectrum synthesis.
This paper is organised as follows. In Section 2, we summarise the selection of sample stars and the available data. In Section 3, we describe the calculations for spectral synthesis and the lines studied. In Section 4, we present the results, along with the data from the literature on the elements studied. In Section 5, the chemical-evolution models are compared with the data. We summarise our conclusions in Section 6.
2 Data and selection sample
As is described in Razera et al. (2022), our selection is based on the reduced proper motion (RPM) stars from Queiroz et al. (2021) that served as a pool to select the sample. The RPM sample from Queiroz et al. (2021), in turn, is based on the stars observed by APOGEE, combined with StarHorse distances (Santiago et al. 2016; Queiroz et al. 2018), and cross-matched with proper motions from the Gaia Early Data Release 3 (Gaia Collaboration 2021). The selection identified stars with a distance to the Galactic centre of dGC < 4 kpc, a maximum height of |Z|max < 3 kpc, an eccentricity >0.7, and orbits not supporting the bar (where the orbits were computed in Queiroz et al. 2021), and imposing a metallicity cut of [Fe/H] < −0.8. By applying kinematical criteria and imposing that the selected stars have spectra from the second generation of the APOGEE-2 – Majewski et al. 2017, a sample of 58 stars was built. A Kiel diagram of this sample was presented in Fig. 3 of Razera et al. (2022).
APOGEE is one of the surveys of the Sloan Digital Sky Survey IV (Blanton et al. 2017, SDSS-IV/V). The APOGEE spectra have a high resolution (R ~ 22 500) and high signal-to-noise ratios in the H band (15 140–16 940 Å) (Wilson et al. 2019), and include about 7×10⁵ stars. APOGEE-1 and APOGEE-2 used the 2.5 m Sloan Foundation Telescope at the Apache Point Observatory in New Mexico (Gunn et al. 2006), and the 2.5 m Irénée du Pont Telescope at the Las Campanas Observatory in Chile (Bowen & Vaughan 1973), respectively. Santana et al. (2021) and Beaton et al. (2021) describe the targeting of APOGEE for the southern and northern hemispheres, respectively. The detectors are H2RG (2048 × 2048) Near-Infrared HgCdTe Detectors with 18 micron pixels.
The analysis of H-band spectra in the APOGEE project is carried out through a Nelder-Mead algorithm (Nelder & Mead 1965), which simultaneously fits the stellar parameters effective temperature (Teff), gravity (log g), metallicity ([Fe/H]), and microturbulence velocity (vt) – together with the abundances of carbon, nitrogen, and α-elements with the APOGEE Stellar Parameter and Chemical Abundances Pipeline (ASPCAP) (García Pérez et al. 2016), which is based on the FERRE code (Allende Prieto et al. 2006) and the APOGEE line list (Smith et al. 2021). In the present work, we use APOGEE Data Release 17 – DR17 (Abdurro’uf et al. 2022) for the stellar parameters, to derive the abundances with spectrum synthesis, in particular for phosphorus, that are not available from DR17; the P abundance is available for only one star in APOGEE DR17, to be discussed in Sect. 3.2.
3 Calculations
We computed the abundances of P, S, and K in the H band using the code TURBOSPECTRUM from Alvarez & Plez (1998) and Plez (2012). The model atmosphere were interpolated within the CN-mild MARCS grids from Gustafsson et al. (2008). The solar abundances of the elements studied - that is, A(P) = 5.41, A(S) =7.12, and A(K) = 5.07 − are from Asplund et al. (2021). Note that, from O and B stars, recently Aschenbrenner et al. (2025) derived a present-day abundance for P, of A(P) = 5.36±0.14, and there are present-day abundances for S, derived by Daflon et al. (2009), of A(S) = 7.15±0.05. We also recomputed the C, N, O abundances, given that in Razera et al. (2022) these abundances were computed with a different code, PFANT (Barbuy et al. 2018b). Here we assumed the solar C, N, O abundances of Asplund et al. (2021), A (C) = 8.46, A (N) = 7.83, and A(O) = 8.69, which are also different solar values from the ones assumed in Razera et al. (2022).
Table 1 reports the lines in the H band that we used to measure the abundances of the elements P, S, and K in the spectra| of the sample stars. Oscillator strengths were adopted from the line list of the APOGEE collaboration, which were initially adopted from the most recent line list of Kurucz & Bell (1995), with log gf values updated with National Institute of Standards and Technology Atomic Spectra Database – NIST values, and adjusted within 2-sigma uncertainties based on the Sun and Arcturus spectra (Smith et al. 2021). For comparison purposes, we also show the log gf values from the Kurucz CD ROM 23, and from the Vienna Atomic Line Database (VALD3): see the line lists of Kurucz & Bell (1995) and Ryabchikova & Pakhomov (2015). We note that log gf values are not available in the NIST database for any of these studied lines. The full atomic line list employed is that from the APOGEE collaboration, together with the molecular lines described in Smith et al. (2021).
We adopted the uncalibrated stellar parameters effective temperature (Teff), gravity (log g), metallicity ([Fe/H]), and micro-turbulence velocity (vt) from the APOGEE DR17 results. These parameters are reported in Table A.1, together with recomputed C, N, O, and the results for P, S, and K abundances.
The use of uncalibrated instead of calibrated parameters could be a matter of debate because the difference in parameters can lead to changes in the abundances derived. While using calibrated parameters may seem to be a more sensible choice for most of the giants of the APOGEE survey, we argue here that this may not be as obvious for our current sample. According to Jönsson et al. (2020), ASPCAP calibrated temperatures have been calibrated using the colour-temperature relation of González Hernández & Bonifacio (2009), which has been tested down to 4000 K, and surface gravities have been calibrated using seismic data from Pinsonneault et al. (2018) and validated down to log ɡ = 1.2. Because our sample, as is reported here in Table A.1, contains only very cool (3600–4300 K) metal-poor ([Fe/H] ~−1.0) low-gravity (log ɡ ≲ 1.2) giants, it is not clear anymore whether the calibrated parameters perform better than the uncalibrated parameters. In addition, we also use a model atmosphere grid that is slightly different in C, N, and α-element composition than APOGEE-ASPCAP. For the cooler stars (Teff) ≲ 3700 K), that will also have a significant impact on the atmosphere structure, and thus on parameters and abundances. However, neither the MARCS atmosphere grid that we use here nor the APOGEE-ASPCAP one strictly matches the abundances of our sample stars and it is not clear which of them is best for such a sample. We still chose the uncalibrated parameters in order to maintain some consistency with the raw results of the APOGEE-ASPCAP pipeline, as was previously discussed in Razera et al. (2022). We also note that in da Silva et al. (2024) we verified the reliability of ASPCAP for deriving stellar parameters, and concluded that the use of molecular-line intensities is a powerful method, in particular for the derivation of effective temperatures. We remind the reader that for DR17 the parameters were obtained with new spectral grids constructed using the Synspec spectrum synthesis code (Hubeny & Lanz 2017; Hubeny et al. 2021).
Line list and oscillator strengths.
3.1 Phosphorus, sulphur, and potassium lines
We analysed the lines of P, S, and K in the H band. The fits were all carried out visually, adopting convolutions with a full width at half maximum (FWHM) from 0.65 to 0.75 Å in the range 15000 to 17 000 Å. These FWHM values are compatible with the ones based on a directly measured FWHM of ~0.7 Å, with 10 to 20 percent variations seen across the wavelength range by Ashok et al. (2021) and Nidever et al. (2015). Although for most of the lines the resulting abundance is similar to that reported in APOGEE-ASPCAP DR17, there are cases in which a visual inspection is needed because of noise or defects. The results are given in Table A.1.
Phosphorus: the two available lines of P I are weak. The P I 15711.522 Å is often too weak, while P I 16482.932 Å is measurable. In about one quarter of the stars, the P I 15711.522 Å line is measurable, and with an abundance compatible with that of the P I 16482.932 Å line. The upper limit of the 15711.522 Å line is compatible with the measurement of the 16482.932 Å line for the other two thirds of stars. We also stress that P measurement was not possible in the spectra where the 16482.932 Å line was too close to the continuum, or too noisy and with strong artefacts – or even falling out of range given the detector edge.
A very important issue is the mixing of the main P I 16482.932 Å line with the molecular lines of CO, which was noted by Hayes et al. (2022) and Brauner et al. (2023). Although we have already derived C, N, and O abundances for these stars in Razera et al. (2022), it is crucial to precisely adjust the strength of the related molecular features to our current methodology. For that we basically used the region 15 520–15 590 Å, which contains a clear CO band-head, clean OH lines, and CN lines spread in this region, as is explained in Barbuy et al. (2021) and Razera et al. (2022). Then, with CO-band lines well fitted, the resulting estimate of P becomes reliable. Figure 1 shows the P I 16482.932 Å in the eight stars with the largest P abundances. The blending with molecular lines is also shown.
Sulphur: there are three measurable lines, but only one is unblended. S I 15403.784 Å is strongly blended with molecular OH lines, plus other atomic lines, and this applies also to 15469.826 Å, but the latter is still useful, as is discussed in Hayes et al. (2022). S I 15475.624 Å is reasonably sensitive to the S abundance but is non-negligibly blended with CN. Also, a few other S I lines fall in the APOGEE gaps. The more reliable feature that is essentially clean from molecular and atomic blending is the line S I 15478.406 Å. Fits to this feature are shown in Figure 2 for stars b11 2M17351981-1948329 and c2 2M17285088-2855427, including the calculations with only molecular lines. Even if this line had more weight, the three features were fitted simultaneously, i.e. 15469.826, 15475.624, and 15478.496 Å, and in some of the stars these features were reasonably fitted.
Potassium: the two available lines are clearly measurable; both have a small blend with CN lines, and they both yield results compatible with each other. Figure 3 illustrates the quality of these lines, as well as the blending CN features, for stars b17 2M17483633-2242483 and c12 2M17323787-2023013.
Table A.1 lists the APOGEE uncalibrated stellar parameters, and the present resulting abundances for the elements P, S, and K, as well as the APOGEE-ASPCAP abundances of S and K, for comparison purposes.
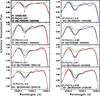 |
Fig. 1 P I 16482.932 Å line in eight sample stars, fitted with synthetic spectra computed with [P/Fe] = 0.0 (green), 1.0 (blue), and final values (red), if different from 0.0 or 1.0. The computations with molecular lines only are shown as dotted black lines. |
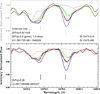 |
Fig. 2 S I 15475.624 and 15478.496 Å lines in stars b11 2M17351981-1948329 and c2 2M17285088-2855427. Observed spectra (black) are compared with synthetic spectra computed with [S/Fe] = 0.0 (green), 1.0 (blue), and final values (red). Dotted lines correspond to molecular lines only. |
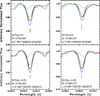 |
Fig. 3 K I 15163.067 and 15168.376 Å lines in the sample stars b17 2M17483633-2242483 and c12 2M17323787-2023013. The observed spectra (black) are fitted with synthetic spectra computed with [K/Fe] = 0.0 for b17 and +0.25 for c12, respectively (red); calculations for −0.2 and +0.2 and shown in green and blue, respectively. Dotted lines correspond to molecular lines only. |
3.2 Uncertainties
There are no calculations of non-LTE deviations for the lines of P I analysed in this work; therefore, these uncertainties cannot be evaluated. Brauner et al. (2023) do not find any trend of P abundances versus temperature, suggesting that NLTE effects for the P lines in the H band should be negligible. For K I the syn-spec calculations from APOGEE DR17 take into account NLTE. Since there are also LTE calculations available, we inspected the differences between the two, and they are negligible, below 0.1 dex. For sulphur, the large spread in the abundance estimates may be improved with NLTE corrections, as it is in the case of lines studied by Korotin et al. (2017), lowering the LTE abundances. Korotin & Kiselev (2024) give grids of NLTE corrections for the lines studied here, indicating corrections: as examples, for [Fe/H] ~ −1.0, Teff = 4000 K, and [S/Fe] = +0.4 the correction is of ~0.16 dex for a gravity log g = 0.0, and ~−0.06 dex for log g = 1.0; for [S/Fe] = +0.8, the corrections are of ~−0.19 and −0.07, respectively. The grid is limited to Teff ≥ 4000 K, and the trend for lower temperatures is a decrease in the correction, whereas for higher effective temperatures the corrections increase. In summary, for the low temperatures of most of our sample stars, the corrections should be ≤−0.06 dex.
Typical systematic uncertainties due to stellar parameters were computed by adopting uncertainties in the stellar parameters of ∆Teff = 100 K, ∆log g = 0.2 dex, and ∆vt = 0.2 km s−1, shown in Table 2. These were applied to the cool star b14 2M17392719-2310311, and the warmer star c16 2M17310874-2956542. This table shows that the P abundance has a dependence on log g, more so for the cooler star, and a low dependence on the effective temperature. Finally, the continuum placement is another source of uncertainty, in particular for the P I line; this adds another 0.1 dex of uncertainty for the noisier spectra. Finally, it is worth nothing that this study of systematic errors offers a good representation of the impact on the abundances due to the use of either uncalibrated or calibrated parameters of APOGEE-ASPCAP DR17 as the difference between those parameters is on average similar to the ones used in Table 2.
Another way to estimate uncertainties on abundances is to compare with the literature. APOGEE-ASPCAP DR17 do not provide P abundances. Nevertheless, we have one star in common with Brauner et al. (2023), b2 2M17173693-2806495. Brauner et al. (2023) report a conservative upper limit of 1.24. The BACCHUS analysis of weak lines in APOGEE spectra (BAWLAS; Hayes et al. 2022, 2023) gives a P abundance for this same star of 0.83. The values are different from our own determination of 0.4, but we recall that the stellar parameters are different (calibrated vs uncalibrated stellar parameters from APOGEE).
Figure 4 shows the difference between the S and K abundances derived in this work and the ones from APOGEE-ASPCAP DR17. The mean difference between the present results and ASPCAP DR17 is found to be:
![Mathematical equation: $\matrix{ {{{\left[ {{\rm{S}}/{\rm{Fe}}} \right]}_{{\rm{present}}}} - {{\left[ {{\rm{S}}/{\rm{Fe}}} \right]}_{{\rm{ASPCAP}}}} = - 0.08_{ - 0.17}^{ + 0.22}} \cr {{{\left[ {{\rm{K}}/{\rm{Fe}}} \right]}_{{\rm{present}}}} - {{\left[ {{\rm{K}}/{\rm{Fe}}} \right]}_{{\rm{ASPCAP}}}} = - 0.04_{ - 0.10}^{ + 0.07}.} \cr } $](/articles/aa/full_html/2025/08/aa55713-25/aa55713-25-eq1.png) (1)
(1)
For S the differences are due to continuum placement, but more so due to measuring only the best line for S, because, as was explained above, the other lines are strongly blended with molecular lines. For K, we measure systematically lower abundances, and this could also be due to continuum placement. The fits are available on request.
Phosphorus, sulphur, and potassium abundance uncertainties for stars b14 and c16, due to changes in stellar parameters of ∆Teff = 100 K, ∆log g = 0.2 dex, and ∆vt = 0.2 km s−1. The corresponding total error is given in the last column.
4 Present results and literature data
The results in Table A.1 can be compared with literature data, all of which can essentially be described in this section, given that there have been few previous observational studies on P, S, and K.
Phosphorus: there are only a few measurements of P abundances in the literature. Caffau et al. (2011) used the CRyogenic high-resolution InfraRed Echelle Spectrograph (CRIRES) at the Very Large Telescope (VLT) spectra to measure the P I 10511.584, 10529.522, 10581.569, and 10596.900 Å lines in 20 disc dwarf stars. Caffau et al. (2016) used the GIANO spec-trograph at the Telescopio Nazionale Galileo (TNG) to measure these same lines in another four disc dwarf stars. Roederer et al. (2014) identified six P I lines using the Space Telescope Imaging Spectrograph (STIS) on board the Hubble Space Telescope (HST) in the near-UV, namely at 2154.080, 2154.121, 2533.976, 2535.603, 2553.262, and 2554.915 Å, relying in the end only on the P I 2136 Å line, for 14 halo stars. Roederer et al. (2016) used the Cosmic Origins spectrograph (COS), also on board the HST, to derive P and S abundances in carbon-rich metal-poor stars. Maas et al. (2019) used the Phoenix spectrograph at the Gemini-South telescope to measure the 10581.560 and 10596.960 Å lines in nine disc stars, and Maas et al. (2022) used the spectra obtained with the Hobby-Eberly Telescope at the McDonald Observatory to measure the P I 10529.52 Å line as the primary indicator of P abundances in 163 disc and outer halo stars. Sadakane & Nishimura (2022) used the ESPaDOnS spectrograph at the Canada–France–Hawaii telescope (CFHT) to observe the 9750.75 and 9796.83 Å lines in 45 main-sequence stars. Nandakumar et al. (2022) used the Immersion GRating INfrared Spectrometer (IGRINS) at the Gemini-South telescope to measure the P I 16482.92 Å line for 38 disc stars. Brauner et al. (2023) analysed 87 stars selected from the APOGEE DR17 survey, including the 16 P-rich stars previously found by Masseron et al. (2020a). Of this sample, 78 stars turned out to be enriched in P ([P/Fe] > +0.8).
Figure 5 shows the literature data compared with the present results. It is interesting that a significant part of the sample stars show a clearly enhanced phosphorus compared to the mean field value. P-rich stars have previously been found in other samples by Masseron et al. (2020a), Brauner et al. (2023), and Brauner et al. (2024). However, we note that Brauner et al. (2023) found more extreme cases of P enhancement than we observe here, which led them to consider a higher limit for the P abundance ([P/Fe] > +0.8) than we do here ([P/Fe] > +0.45) to consider the star as P-rich. Nevertheless, it is intriguing that the P-rich stars from Masseron et al. (2020a,b) and Brauner et al. (2023), discussed further in Brauner et al. (2024), have metallicities around [Fe/H] ~−1.0, coinciding with the same effect in our sample stars at the same metallicities. This might confirm the findings of our previous studies (Razera et al. 2022; Barbuy et al. 2023, 2024); namely, that there is an old population of stars that are the result of an early fast chemical enrichment in the Milky Way towards the Galactic bulge. To confirm this conclusion, the orbital analysis of the Masseron-Brauner sample of P-rich stars led these authors to identify most of their sample as belonging to the thick disc and the inner Galactic halo, and thus also old populations. Moreover, the results obtained by Roederer et al. (2014) seem to indicate that no P-rich stars are present among the very metal-poor halo stars ([Fe/H] ≤ −2.0), although this sample is small and thus statistically not very robust to draw firm conclusions.
Finally, we verified possible correlations between the P abundances and the other elements, C, N, O, Na, Al, Si, and Ca, and iron-peak elements previously studied (Razera et al. 2022; Barbuy et al. 2023, 2024). Brauner et al. (2023) found a strong correlation between P and Si in their P-rich star sample. However, this is not as clear in our study. While it is not possible to make a direct qualitative comparison between those two studies because of differences in stellar parameters and procedures, the difference in the correlation could also be due to the limited P abundance range of the current sample (0.5≤[P/Fe]≤1.0). Indeed, in Brauner et al. (2023), within such a limited range ofP abundances, the P-Si correlation tends to vanish.
Sulphur: Figure 6 shows the present sulphur abundances compared with literature data, described below. Francois (1987) and Israelian & Rebolo (2001) analysed the S I 8693.958, 8694.641 Å lines. Takada-Hidai et al. (2002) gathered High Resolution Echelle Spectrometer (HIRES) observations with the samples observed by Francois (1987, 1988) and Clegg et al. (1981) for these same lines, and derived both LTE and non-LTE abundances. We adopted their NLTE [FeI/H] and [S/FeI] results for comparison purposes. Chen et al. (2002) used these same lines plus the lines S I 6046.03, 6052.67, and 6757.17 Å. Takada-Hidai et al. (2002) used the 8693.958 and 8694.641 Å lines to derive the S abundances of giants and dwarfs from several samples, including their own, plus the ones from Francois (1987, 1988) and Clegg et al. (1981). Korn & Ryde (2005) used these lines and the S I 9212.9, 9228.1, and 9237.5 Å lines. Nissen et al. (2007) analysed the weaker S I 8694.6 and the stronger S I 9212.9 and 9237.5 Å lines, and presented abundances derived in LTE and NLTE. Spite et al. (2011) used several lines, namely S I 6756.851, 6757.007, 6757.171, 8693.931, 8694.626, 9212.863, 9228.093, 9237.538, 10455.449, 10456.757, 10459.406, and 10821.176 Å lines, and carried out NLTE calculations. Caffau et al. (2016) measured the 10455.449, 10456.757, and 10459.406 Å lines, and computed NLTE abundances. Perdigon et al. (2021) analysed the S I 6743.440, 6743.531, 6743.640, 6748.573, 6748.682, 6748.837, 6756.851, 6757.007, and 6757.171 Å lines, and computed LTE abundances, arguing that NLTE corrections would be smaller than 0.1 dex, following Takeda et al. (2016) and Korotin et al. (2017). Lucertini etal. (2022) measured the lines S I 6757.171, 8694.626, 9212.863, 9228.093, and 9237.538 Å.
Potassium: Figure 7 shows the K abundances for our sample of 58 stars compared with literature data. Zhang et al. (2006) derived K abundances from the K I 7664.92, and 7698.98 Å lines for moderately metal-poor disc stars, providing results corrected for NLTE effects. Andrievsky et al. (2010) computed NLTE K abundances for the sample halo stars from Cayrel et al. (2004), for the lines K I 5801.752, 7698.965, and 12432.274 Å. Reinhard & Laird (2024) derived LTE K abundances for 20 halo stars.
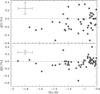 |
Fig. 4 [S, K/Fe] vs. [Fe/H], plotting the differences between the present results and the APOGEE DR17 values. Error bars correspond to the errors for the cool star b14 reported in Table 2. |
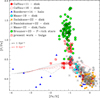 |
Fig. 5 [P/Fe] vs. [Fe/H] for the present results compared with literature data. Symbols – open red stars: present work, filled red circles: Caffau et al. (2011), open red circles: Caffau et al. (2016), filled blue triangles: Roederer et al. (2014), filled cyan circles and open black circles: Maas et al. (2019), filled light grey circles: Nandakumar et al. (2022), open four-pointed light grey stars: Maas et al. (2022), filled green circles and open black circles: Brauner et al. (2023). Different model lines correspond to the outputs of models computed for radii of r < 0.5, 0.5 < r < 1,1 < r < 2, and 2 < r < 3 kpc from the Galactic centre. Black lines correspond to specific star formation of v =1 Gyr−1, and red lines to v = 3 Gyr−1. |
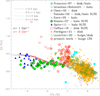 |
Fig. 6 [S/Fe] vs. [Fe/H] for the present results compared with literature data. Symbols – open red stars: present work, filled cyan circles: Francois (1987), open red squares: Israelian & Rebolo (2001), filled light grey circles: Chen et al. (2002), four-pointed light grey stars: Korn & Ryde (2005), filled green circles and open black circles: Nissen et al. (2007), filled blue triangles: Spite et al. (2011), open red circles: Caffau et al. (2016), filled orange triangles: Perdigon et al. (2021), open forest green squares: Lucertini et al. (2022). Same as in Fig. 5 for the model lines. |
5 Chemical-evolution of P, S, K
5.1 Nucleosynthesis
Phosphorus: Brauner et al. (2024) considered the nucleosynthesis options to explain the P excess in stars of metallicity [Fe/H] ≈ −1.0, and could not identify a process responsible for this effect. Normally, P is produced in CCSNe through neutron captures on the Si isotopes. 31P, together with 28Si and 30Si, are produced in the oxygen- and neon-burning shells, and then ejected at the supernova core-collapse event (Woosley & Weaver 1995). During the explosion, according to Pignatari et al. (2016), there is some production of 31P by explosive C burning and explosive He burning. One possible explanation for the large excess of P was given by Bekki & Tsujimoto (2024) through P production in oxygen-neon (ONe) novae. However, it is not clear why this would take place only in the environment where the old bulge stars of a moderate metallicity were formed.
There is also the possibility of enrichment by asymptotic giant branch (AGB) stars, where31 P is the result of neutron-capture on 30Si. However, this latter contribution is less likely as this is expected to occur in only very metal-poor AGBs (Karakas & Lugaro 2016).
Sulphur: sulphur is an α element; therefore, it is expected to behave like O, Mg, Si, and Ca, being produced in massive stars and ejected by SNe II.
Potassium: 39K is the majority isotope, comprising 93.132%, followed by 41K with 6.721% and 40K with 0.147% (Asplund et al. 2009). The 39,41K isotopes are dominantly produced in CCSNe (Pignatari et al. 2016).
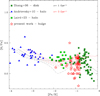 |
Fig. 7 [K/Fe] vs. [Fe/H] for the present results compared with literature data Symbols – open red stars: present work, dark green squares: Zhang et al. (2006), filled blue triangles: Andrievsky et al. (2010), filled green squares and open black squares: Reinhard & Laird (2024). Same as in Fig. 5 for the model lines. |
5.2 Chemical-evolution models
The chemical-evolution model for the Galactic bulge derives from the chemical-evolution model for elliptical galaxies of Friaca & Terlevich (1998). This model consists of a multi-zone chemical evolution coupled with a hydrodynamical code. For the Galactic bulge, a classical spheroid with a baryonic mass of 2×10⁹ M⊙ and a dark halo mass of 1.3×10¹⁰ M⊙ are assumed. Cosmological parameters from the Planck Collaboration VI (2020) are adopted; namely, Ωm = 0.31, Ωλ = 0.69, Hubble constant H0 = 68 km s−1Mpc−1, and an age of the Universe of 13.801±0.024 Gyr.
For the nucleosynthesis yields, we adopted: (i) for massive stars, the metallicity-dependent yields from CCSNe/SNe II from Woosley & Weaver (1995), and for low metallicities (Z < 0.01 Z⊙, or [Fe/H] < −2.5), the yields from high-explosion-energy HNe from Nomoto et al. (2013); (ii) type Ia supernovae (SNIa) yields from Iwamoto et al. (1999) – their models W7 (progenitor star of initial metallicity Z = Z⊙) and W70 (zero initial metallicity); and (iii) for intermediate-mass stars (0.8–8 M⊙) with initial Z = 0.001, 0.004, 0.008, 0.02, and 0.4, yields from van den Hoek & Groenewegen (1997) with variable η (AGB case).
Our nucleosynthesis prescriptions also consider neutrino-interaction processes, which could be important at very low metallicities. Core-collapse supernovae release large amounts of energy as neutrinos (> 1053 erg) during the formation of the neutron star or black hole. In this case, the interaction of these neutrinos with matter could significantly increase the yields of odd-Z elements (Yoshida et al. 2008). Therefore, for the super-novae with very low-metallicity progenitors, our models include the enhancements by neutrino processes of the production of odd-Z elements such as phosphorus and potassium. In this paper, we adopt the results of the calculations of Yoshida et al. (2008) for the case with the total neutrino energy of the supernova explosion, Eν = 3 × 1053 erg, and a neutrino temperature of Tν = 8 Mev.
In our calculations, we multiplied the yields from WW95 for sub-solar metallicities by a factor of 2 for P and a factor of 3 for K. The factor of 2 for P is the same factor adopted for cobalt, as suggested by Timmes et al. (1995) and adopted by Ernandes et al. (2020). The value of this correction comes from the comparison of [P/Fe] and [Fe/H] given by Figure 23 of Timmes et al. (1995) and the observations of Caffau et al. (2011). In the case of K, the Galactic chemical evolution model of Timmes et al. (1995), using yields of WW95, shows a sharp drop of [K/Fe] below [Fe/H] ≈ 0.6, in serious disagreement with the observations (see their Figure 24). The factor of 2 for P is similar, but smaller than the factor of 2.75 adopted by Cescutti et al. (2012). These corrections reflect the perception that the WW95 yields for Z < Z⊙ tend to underestimate the production of some odd-Z elements. On the other hand, for [Fe/H] < −2.5, our models, which include HNe and neutrino processes in supernovae, account for the observations and do not need further corrections.
Models were computed for radii of r < 0.5, 0.5 < r < 1, 1 < r < 2, and 2 < r < 3 kpc from the Galactic centre, and for specific star formation rate values of v = 1 and 3 Gyr−1.
Figure 5 overplots the chemical-evolution models for specific star formation rates of v = 1 and 3 Gyr−1 for the phosphorus data. It is interesting to note that, at metallicities of [Fe/H] ~ −1.0, there is a maximum [P/Fe] = +0.423 at [Fe/H] = −0.825 for the model with v = 1, and [P/Fe] = +0.479 at Fe/H] = −0.827 for the model with v = 3. Moreover, the maximum [P/Fe] in the models approximately coincides with the metallicities of the P-rich stars, although the very high levels of P are not reached. This maximum arises from the yields of the Woosley & Weaver (1995) models. About one third of the stars show higher values relative to the models. In summary, the nucleosynthesis scenario for P excess has not been identified yet, and different possibilities remain open.
Figure 6 overplots the chemical-evolution models for specific star formation rates of v =1 and 3 Gyr−1, for our results and literature data for sulphur described above. Our data seems to indicate that sulphur is enhanced in the bulge. Although a first thought is that NLTE effects could be artificially enhancing the abundance and the spread, the grid of NLTE corrections by Korotin & Kiselev (2024) indicates only rather low values for the corrections. On the other hand, the amplitude of such an effect on sulphur can be notably illustrated by comparing the LTE studies (e.g. Israelian & Rebolo 2001) – which also found enhanced sulphur in halo stars – to other studies of a similar population but in NLTE (Nissen et al. 2007, e.g. ). We also argue that sulphur as an α element is not expected to behave distinctively from other α elements such as O, Mg, and Ca. Previous studies of bulge stars (Gonzalez et al. 2011) have demonstrated that Mg, Ca, or Ti abundances in metal-poor bulge stars are indistinguishable from the ones of the thick disc and halo stars at the same metallicities. Therefore, we conclude that our sulphur abundances are very likely overestimated, and that S abundances are expected to be compatible with the ones of the disc and halo at similar metallicities such as the ones found in other stars of the bulge by Lucertini et al. (e.g. 2022). Regarding the comparison of the data with the models, we confirm that the latter satisfactorily reproduce the behaviour of [S/Fe] against [Fe/H] over the full metallicity range.
Figure 7 overplots the results for K, with the models showing very good agreement with the data.
6 Conclusions
This is the fourth paper in a series dealing with the chemical-abundance analysis of 58 stars selected to have [Fe/H] < −0.8 and orbits compatible with being members of a spheroidal component of the Galactic bulge. In the present work, we used suitable lines to compute the abundances of the elements P, S, and K. The abundances of P were not available from the APOGEE-ASPCAP DR17 results.
A striking result is the relative overabundance of P for about one third of the stars in the sample, a phenomenon that may be related to the P-rich star phenomenon described by Masseron et al. (2020a,b), Brauner et al. (2023), and Brauner et al. (2024), although more moderate. In the present work, the over-abundance of P is seen in some of these old bulge stars, for the first time, and from literature data. For the other two thirds of the sample, the P abundances are compatible with the chemical evolution models. Further samples should be analysed in order to have more solid statistics on the number of P-rich versus P-normal stars in the Galactic bulge. It is remarkable that no P-rich stars are present in the most metal-poor bulge stars as well as in the very metal-poor halo stars. It appears that these over-abundances are not observed in other stellar populations, and this might indicate the contribution of a particular kind of early supernova operating in the central part of the Galaxy. The nucleosynthesis process involved is, however, not yet clearly identified.
Sulphur is an α element, and behaves as such, as is seen in the comparison with chemical-evolution models. We stress though that the present results rely on one line, and the abundances have not been corrected for non-LTE departures, given that the Korotin & Kiselev (2024) grid is limited to higher temperatures relative to our sample. Their corrections indicate a negligible correction, but this problem should be further investigated in order to explain the discrepancies between our results and the models.
Potassium is another little-studied element. The chemical-evolution models fit the behaviour of [K/Fe] with regard to metallicity remarkably well; this is partly due to the inclusion of the v-process yields in the models.
Acknowledgements
B.B. and A.C.S.F. acknowledge grants from FAPESP, Conselho Nacional de Desenvolvimento Científico e Tecnológico (CNPq) and Coordenação de Aperfeiçoamento de Pessoal de Nível Superior (CAPES) - Financial code 001. H.E. acknowledges a post-doctoral fellowship at Lund Observatory. M.S.C. acknowledges a CAPES doctoral fellowship. P.S. acknowledges the FAPESP post-doctoral fellowships 2020/13239-5 and 2022/14382-1. S.O.S. acknowledges the support from Dr. Nadine Neumayer’s Lise Meitner grant from the Max Planck Society. A.P.-V., B.B., and S.O.S. acknowledge the DGAPA-PAPIIT grant IA103224. BB, HE, PS and SOS are part of the Brazilian Participation Group (BPG) in the Sloan Digital Sky Survey (SDSS), from the Laboratório Interinstitucional de e-Astronomia – LIneA, Brazil. T.M. acknowledges support from the Spanish Ministry of Science and Innovation with the proyecto plan nacional PLAtoSOnG (grant no. PID2023-146453NB-100). M.B. acknowledges financial support from the European Union and the State Agency of Investigation of the Spanish Ministry of Science and Innovation (MICINN) under the grant PRE-2020-095531 of the Severo Ochoa Program for the Training of Pre-Doc Researchers (FPI-SO). J.G.F-T gratefully acknowledges the grant support provided by Proyecto Fondecyt Iniciación No. 11220340, Proyecto Fondecyt Postdoc No. 3230001 (Sponsored by J.G.F-T) and from the Joint Committee ESO-Government of Chile 2021 (ORP 023/2021), and 2023 (ORP 062/2023). F.A. acknowledges partial supported by the Spanish MICIN/AEI/10.13039/501100011033 and by “ERDF A way of making Europe” by the “European Union” through grant PID2021-122842OB-C21, and the Institute of Cosmos Sciences University of Barcelona (ICCUB, Unidad de Excelencia ’Maria de Maeztu’) through grant CEX2019-000918-M. F.A. acknowledges the grant RYC2021-031683-I funded by MCIN/AEI/10.13039/501100011033 and by the European Union NextGenerationEU/PRTR. D.M. gratefully acknowledges support from the Center for Astrophysics and Associated Technologies (CATA) by ANID BASAL projects ACE210002 and FB210003, and Fondecyt Project No. 1220724. D.G. gratefully acknowledges the support provided by Fondecyt regular no. 1220264. D.G. also acknowledges financial support from the Dirección de Investigación y Desarrollo de la Universidad de La Serena through the Programa de Incentivo a la Investigación de Académicos (PIA-DIDULS). The work of V.V.S. and V.M.P. is supported by NOIRLab, which is managed by the Association of Universities for Research in Astronomy (AURA) under a cooperative agreement with the U.S. National Science Foundation. T.C.B. acknowledges support from grant PHY 14-30152; Physics Frontier Center/JINA Center for the Evolution of the Elements (JINA-CEE), and from OISE-1927130: the International Research Network for Nuclear Astrophysics (IReNA), awarded by the US National Science Foundation. Apogee project: Funding for the Sloan Digital Sky Survey IV has been provided by the Alfred P. Sloan Foundation, the U.S. Department of Energy Office of Science, and the Participating Institutions. SDSS acknowledges support and resources from the Center for High-Performance Computing at the University of Utah. The SDSS web site is www.sdss.org. SDSS is managed by the Astrophysical Research Consortium for the Participating Institutions of the SDSS Collaboration including the Brazilian Participation Group, the Carnegie Institution for Science, Carnegie Mellon University, Center for Astrophysics | Harvard & Smithsonian (CfA), the Chilean Participation Group, the French Participation Group, Instituto de Astrofísica de Canarias, The Johns Hopkins University, Kavli Institute for the Physics and Mathematics of the Universe (IPMU)/University of Tokyo, the Korean Participation Group, Lawrence Berkeley National Laboratory, Leibniz Institut für Astrophysik Potsdam (AIP), Max-Planck-Institut für Astronomie (MPIA Heidelberg), Max-Planck-Institut für Astrophysik (MPA Garching), Max-Planck-Institut für Extraterrestrische Physik (MPE), National Astronomical Observatories of China, New Mexico State University, New York University, University of Notre Dame, Observatório Nacional/MCTI, The Ohio State University, Pennsylvania State University, Shanghai Astronomical Observatory, United Kingdom Participation Group, Universidad Nacional Autónoma de México, University of Arizona, University of Colorado Boulder, University of Oxford, University of Portsmouth, University of Utah, University of Virginia, University of Washington, University of Wisconsin, Vanderbilt University, and Yale University.
Appendix A Additional table
Internal and 2MASS star identification, the ASPCAP uncalibrated stellar parameters, recomputed C, N, O abundances, the abundances of P, S, and K derived in this work, and the APOGEE-ASPCAP abundances of S and K.
References
- Abdurro’uf, Accetta, K., Aerts, C., et al. 2022, ApJS, 259, 35 [NASA ADS] [CrossRef] [Google Scholar]
- Allende Prieto, C., Beers, T. C., Wilhelm, R., et al. 2006, ApJ, 636, 804 [NASA ADS] [CrossRef] [Google Scholar]
- Alvarez, R., & Plez, B. 1998, A&A, 330, 1109 [NASA ADS] [Google Scholar]
- Andrievsky, S. M., Spite, M., Korotin, S. A., et al. 2010, A&A, 509, A88 [NASA ADS] [CrossRef] [EDP Sciences] [Google Scholar]
- Aschenbrenner, P., Butler, K., & Przybilla, N. 2025, A&A, 698, A164 [NASA ADS] [CrossRef] [EDP Sciences] [Google Scholar]
- Ashok, A., Zasowski, G., Seth, A., et al. 2021, AJ, 161, 167 [NASA ADS] [CrossRef] [Google Scholar]
- Asplund, M., Grevesse, N., Sauval, A. J., & Scott, P. 2009, ARA&A, 47, 481 [NASA ADS] [CrossRef] [Google Scholar]
- Asplund, M., Amarsi, A. M., & Grevesse, N. 2021, A&A, 653, A141 [NASA ADS] [CrossRef] [EDP Sciences] [Google Scholar]
- Barbuy, B., Chiappini, C., & Gerhard, O. 2018a, ARA&A, 56, 223 [Google Scholar]
- Barbuy, B., Muniz, L., Ortolani, S., et al. 2018b, A&A, 619, A178 [NASA ADS] [CrossRef] [EDP Sciences] [Google Scholar]
- Barbuy, B., Ernandes, H., Souza, S. O., et al. 2021, A&A, 648, A16 [NASA ADS] [CrossRef] [EDP Sciences] [Google Scholar]
- Barbuy, B., Friaça, A. C. S., Ernandes, H., et al. 2023, MNRAS, 526, 2365 [NASA ADS] [CrossRef] [Google Scholar]
- Barbuy, B., Friaça, A. C. S., Ernandes, H., et al. 2024, A&A, 691, A296 [NASA ADS] [CrossRef] [EDP Sciences] [Google Scholar]
- Beaton, R. L., Oelkers, R. J., Hayes, C. R., et al. 2021, AJ, 162, 302 [NASA ADS] [CrossRef] [Google Scholar]
- Bekki, K., & Tsujimoto, T. 2024, ApJ, 967, L1 [NASA ADS] [CrossRef] [Google Scholar]
- Bica, E., Ortolani, S., & Barbuy, B. 2016, PASA, 33, e028 [Google Scholar]
- Bica, E., Ortolani, S., Barbuy, B., & Oliveira, R. A. P. 2024, A&A, 687, A201 [NASA ADS] [CrossRef] [EDP Sciences] [Google Scholar]
- Blanton, M. R., Bershady, M. A., Abolfathi, B., et al. 2017, AJ, 154, 28 [Google Scholar]
- Bowen, I. S., & Vaughan, A. H., J. 1973, Appl. Opt., 12, 1430 [NASA ADS] [CrossRef] [Google Scholar]
- Brauner, M., Masseron, T., García-Hernández, D. A., et al. 2023, A&A, 673, A123 [NASA ADS] [CrossRef] [EDP Sciences] [Google Scholar]
- Brauner, M., Pignatari, M., Masseron, T., García-Hernández, D. A., & Lugaro, M. 2024, A&A, 690, A262 [NASA ADS] [CrossRef] [EDP Sciences] [Google Scholar]
- Caffau, E., Bonifacio, P., Faraggiana, R., & Steffen, M. 2011, A&A, 532, A98 [NASA ADS] [CrossRef] [EDP Sciences] [Google Scholar]
- Caffau, E., Andrievsky, S., Korotin, S., et al. 2016, A&A, 585, A16 [NASA ADS] [CrossRef] [EDP Sciences] [Google Scholar]
- Cayrel, R., Depagne, E., Spite, M., et al. 2004, A&A, 416, 1117 [NASA ADS] [CrossRef] [EDP Sciences] [Google Scholar]
- Cescutti, G., Matteucci, F., Caffau, E., & François, P. 2012, A&A, 540, A33 [NASA ADS] [CrossRef] [EDP Sciences] [Google Scholar]
- Chen, Y. Q., Nissen, P. E., Zhao, G., & Asplund, M. 2002, A&A, 390, 225 [NASA ADS] [CrossRef] [EDP Sciences] [Google Scholar]
- Chiappini, C., Frischknecht, U., Meynet, G., et al. 2011, Nature, 472, 454 [Google Scholar]
- Clegg, R. E. S., Lambert, D. L., & Tomkin, J. 1981, ApJ, 250, 262 [NASA ADS] [CrossRef] [Google Scholar]
- da Silva, P., Barbuy, B., Ernandes, H., et al. 2024, A&A, 687, A66 [NASA ADS] [CrossRef] [EDP Sciences] [Google Scholar]
- Daflon, S., Cunha, K., de la Reza, R., Holtzman, J., & Chiappini, C. 2009, AJ, 138, 1577 [Google Scholar]
- Ernandes, H., Barbuy, B., Friaça, A. C. S., et al. 2020, A&A, 640, A89 [NASA ADS] [CrossRef] [EDP Sciences] [Google Scholar]
- Fernández-Trincado, J. G., Minniti, D., Beers, T. C., et al. 2020, A&A, 643, A145 [Google Scholar]
- Francois, P. 1987, A&A, 176, 294 [NASA ADS] [Google Scholar]
- Francois, P. 1988, A&A, 195, 226 [Google Scholar]
- Friaça, A. C. S., & Barbuy, B. 2017, A&A, 598, A121 [NASA ADS] [CrossRef] [EDP Sciences] [Google Scholar]
- Friaca, A. C. S., & Terlevich, R. J. 1998, MNRAS, 298, 399 [CrossRef] [Google Scholar]
- Gaia Collaboration (Brown, A. G. A., et al.) 2021, A&A, 649, A1 [NASA ADS] [CrossRef] [EDP Sciences] [Google Scholar]
- Gao, L., Theuns, T., Frenk, C. S., et al. 2010, MNRAS, 403, 1283 [CrossRef] [Google Scholar]
- García Pérez, A. E., Allende Prieto, C., Holtzman, J. A., et al. 2016, AJ, 151, 144 [Google Scholar]
- Geisler, D., Parisi, M. C., Dias, B., et al. 2023, A&A, 669, A115 [NASA ADS] [CrossRef] [EDP Sciences] [Google Scholar]
- Gonzalez, O. A., Rejkuba, M., Zoccali, M., et al. 2011, A&A, 530, A54 [NASA ADS] [CrossRef] [EDP Sciences] [Google Scholar]
- González Hernández, J. I., & Bonifacio, P. 2009, A&A, 497, 497 [Google Scholar]
- Gunn, J. E., Siegmund, W. A., Mannery, E. J., et al. 2006, AJ, 131, 2332 [NASA ADS] [CrossRef] [Google Scholar]
- Gustafsson, B., Edvardsson, B., Eriksson, K., et al. 2008, A&A, 486, 951 [NASA ADS] [CrossRef] [EDP Sciences] [Google Scholar]
- Hayes, C. R., Masseron, T., Sobeck, J., et al. 2022, ApJS, 262, 34 [NASA ADS] [CrossRef] [Google Scholar]
- Hayes, C., Masseron, T., Sobeck, J., et al. 2023, in American Astronomical Society Meeting Abstracts, 241, 401.07 [Google Scholar]
- Hubeny, I., &Lanz, T. 2017, arXive-prints [arXiv: 1706.01059] [Google Scholar]
- Hubeny, I., Allende Prieto, C., Osorio, Y., & Lanz, T. 2021, arXiv e-prints [arXiv:2104.02829] [Google Scholar]
- Israelian, G., & Rebolo, R. 2001, ApJ, 557, L43 [Google Scholar]
- Iwamoto, K., Brachwitz, F., Nomoto, K., et al. 1999, ApJS, 125, 439 [NASA ADS] [CrossRef] [Google Scholar]
- Jacobson, H. R., Thanathibodee, T., Frebel, A., et al. 2014, ApJ, 796, L24 [NASA ADS] [CrossRef] [Google Scholar]
- Jönsson, H., Holtzman, J. A., Allende Prieto, C., et al. 2020, AJ, 160, 120 [Google Scholar]
- Karakas, A. I. & Lugaro, M. 2016, ApJ, 825, 26 [NASA ADS] [CrossRef] [Google Scholar]
- Kobayashi, C., Umeda, H., Nomoto, K., Tominaga, N., & Ohkubo, T. 2006, ApJ, 653, 1145 [NASA ADS] [CrossRef] [Google Scholar]
- Korn, A. J., & Ryde, N. 2005, A&A, 443, 1029 [NASA ADS] [CrossRef] [EDP Sciences] [Google Scholar]
- Korotin, S. A., & Kiselev, K. O. 2024, Astron. Rep., 68, 1159 [Google Scholar]
- Korotin, S., Andrievsky, S., Caffau, E., & Bonifacio, P. 2017, in Astronomical Society of the Pacific Conference Series, 510, Stars: From Collapse to Collapse, eds. Y. Y. Balega, D. O. Kudryavtsev, I. I. Romanyuk, & I. A. Yakunin, 141 [Google Scholar]
- Kurucz, R., & Bell, B. 1995, Robert Kurucz CD-ROM, 23 [Google Scholar]
- Lucertini, F., Monaco, L., Caffau, E., Bonifacio, P., & Mucciarelli, A. 2022, A&A, 657, A29 [NASA ADS] [CrossRef] [EDP Sciences] [Google Scholar]
- Lucey, M., Hawkins, K., Ness, M., et al. 2021, MNRAS, 501, 5981 [NASA ADS] [CrossRef] [Google Scholar]
- Maas, Z. G., Cescutti, G., & Pilachowski, C. A. 2019, AJ, 158, 219 [NASA ADS] [CrossRef] [Google Scholar]
- Maas, Z. G., Hawkins, K., Hinkel, N. R., et al. 2022, AJ, 164, 61 [NASA ADS] [CrossRef] [Google Scholar]
- Majewski, S. R., Schiavon, R. P., Frinchaboy, P. M., et al. 2017, AJ, 154, 94 [NASA ADS] [CrossRef] [Google Scholar]
- Masseron, T., García-Hernández, D. A., Santoveña, R., et al. 2020a, Nat. Commun., 11, 3759 [NASA ADS] [CrossRef] [Google Scholar]
- Masseron, T., García-Hernández, D. A., Zamora, O., & Manchado, A. 2020b, ApJ, 904, L1 [Google Scholar]
- Matteucci, F. 2021, A&A Rev., 29, 5 [NASA ADS] [CrossRef] [Google Scholar]
- Nandakumar, G., Ryde, N., Montelius, M., et al. 2022, A&A, 668, A88 [NASA ADS] [CrossRef] [EDP Sciences] [Google Scholar]
- Nelder, J. A., & Mead, H. 1965, Comput. J., 7, 308 [CrossRef] [Google Scholar]
- Nidever, D. L., Holtzman, J. A., Allende Prieto, C., et al. 2015, AJ, 150, 173 [NASA ADS] [CrossRef] [Google Scholar]
- Nissen, P. E., Akerman, C., Asplund, M., et al. 2007, A&A, 469, 319 [NASA ADS] [CrossRef] [EDP Sciences] [Google Scholar]
- Nomoto, K., Kobayashi, C., & Tominaga, N. 2013, ARA&A, 51, 457 [CrossRef] [Google Scholar]
- Perdigon, J., de Laverny, P., Recio-Blanco, A., et al. 2021, A&A, 647, A162 [NASA ADS] [CrossRef] [EDP Sciences] [Google Scholar]
- Pérez-Villegas, A., Barbuy, B., Kerber, L. O., et al. 2020, MNRAS, 491, 3251 [Google Scholar]
- Pignatari, M., Herwig, F., Hirschi, R., et al. 2016, ApJS, 225, 24 [NASA ADS] [CrossRef] [Google Scholar]
- Pinsonneault, M. H., Elsworth, Y. P., Tayar, J., et al. 2018, ApJS, 239, 32 [Google Scholar]
- Planck Collaboration VI. 2020, A&A, 641, A6 [NASA ADS] [CrossRef] [EDP Sciences] [Google Scholar]
- Plez, B. 2012, Turbospectrum: Code for spectral synthesis, Astrophysics Source Code Library [record ascl:1205.004] [Google Scholar]
- Queiroz, A. B. A., Anders, F., Santiago, B. X., et al. 2018, MNRAS, 476, 2556 [Google Scholar]
- Queiroz, A. B. A., Chiappini, C., Perez-Villegas, A., et al. 2021, A&A, 656, A156 [NASA ADS] [CrossRef] [EDP Sciences] [Google Scholar]
- Razera, R., Barbuy, B., Moura, T. C., et al. 2022, MNRAS, 517, 4590 [CrossRef] [Google Scholar]
- Reinhard, M. V., & Laird, J. B. 2024, AJ, 167, 6 [Google Scholar]
- Roederer, I. U., Jacobson, H. R., Thanathibodee, T., Frebel, A., & Toller, E. 2014, ApJ, 797, 69 [NASA ADS] [CrossRef] [Google Scholar]
- Roederer, I. U., Placco, V. M., & Beers, T. C. 2016, ApJ, 824, L19 [NASA ADS] [CrossRef] [Google Scholar]
- Rossi, L. J., Ortolani, S., Barbuy, B., Bica, E., & Bonfanti, A. 2015, MNRAS, 450, 3270 [NASA ADS] [CrossRef] [Google Scholar]
- Ryabchikova, T., & Pakhomov, Y. 2015, Baltic Astron., 24, 453 [NASA ADS] [Google Scholar]
- Sadakane, K., & Nishimura, M. 2022, PASJ, 74, 298 [Google Scholar]
- Sales-Silva, J. V., Cunha, K., Smith, V. V., et al. 2024, ApJ, 965, 119 [NASA ADS] [CrossRef] [Google Scholar]
- Santana, F. A., Beaton, R. L., Covey, K. R., et al. 2021, AJ, 162, 303 [NASA ADS] [CrossRef] [Google Scholar]
- Santiago, B. X., Brauer, D. E., Anders, F., et al. 2016, A&A, 585, A42 [NASA ADS] [CrossRef] [EDP Sciences] [Google Scholar]
- Smith, V. V., Bizyaev, D., Cunha, K., et al. 2021, AJ, 161, 254 [NASA ADS] [CrossRef] [Google Scholar]
- Spite, M., Caffau, E., Andrievsky, S. M., et al. 2011, A&A, 528, A9 [NASA ADS] [CrossRef] [EDP Sciences] [Google Scholar]
- Takada-Hidai, M., Takeda, Y., Sato, S., et al. 2002, ApJ, 573, 614 [NASA ADS] [CrossRef] [Google Scholar]
- Takeda, Y., Omiya, M., Harakawa, H., & Sato, B. 2016, PASJ, 68, 81 [Google Scholar]
- Timmes, F. X., Woosley, S. E., & Weaver, T. A. 1995, ApJS, 98, 617 [NASA ADS] [CrossRef] [Google Scholar]
- van den Hoek, L. B., & Groenewegen, M. A. T. 1997, A&AS, 123, 305 [NASA ADS] [CrossRef] [EDP Sciences] [Google Scholar]
- Wilson, J. C., Hearty, F. R., Skrutskie, M. F., et al. 2019, PASP, 131, 055001 [NASA ADS] [CrossRef] [Google Scholar]
- Wise, J. H., Turk, M. J., Norman, M. L., & Abel, T. 2012, ApJ, 745, 50 [NASA ADS] [CrossRef] [Google Scholar]
- Woosley, S. E., & Weaver, T. A. 1995, in American Institute of Physics Conference Series, 327, Nuclei in the Cosmos III, eds. M. Busso, C. M. Raiteri, & R. Gallino (AIP), 365 [Google Scholar]
- Yoshida, T., Suzuki, T., Chiba, S., et al. 2008, ApJ, 686, 448 [Google Scholar]
- Zhang, H. W., Gehren, T., Butler, K., Shi, J. R., & Zhao, G. 2006, A&A, 457, 645 [NASA ADS] [CrossRef] [EDP Sciences] [Google Scholar]
All Tables
Phosphorus, sulphur, and potassium abundance uncertainties for stars b14 and c16, due to changes in stellar parameters of ∆Teff = 100 K, ∆log g = 0.2 dex, and ∆vt = 0.2 km s−1. The corresponding total error is given in the last column.
Internal and 2MASS star identification, the ASPCAP uncalibrated stellar parameters, recomputed C, N, O abundances, the abundances of P, S, and K derived in this work, and the APOGEE-ASPCAP abundances of S and K.
All Figures
|
Fig. 1 P I 16482.932 Å line in eight sample stars, fitted with synthetic spectra computed with [P/Fe] = 0.0 (green), 1.0 (blue), and final values (red), if different from 0.0 or 1.0. The computations with molecular lines only are shown as dotted black lines. |
| In the text | |
|
Fig. 2 S I 15475.624 and 15478.496 Å lines in stars b11 2M17351981-1948329 and c2 2M17285088-2855427. Observed spectra (black) are compared with synthetic spectra computed with [S/Fe] = 0.0 (green), 1.0 (blue), and final values (red). Dotted lines correspond to molecular lines only. |
| In the text | |
|
Fig. 3 K I 15163.067 and 15168.376 Å lines in the sample stars b17 2M17483633-2242483 and c12 2M17323787-2023013. The observed spectra (black) are fitted with synthetic spectra computed with [K/Fe] = 0.0 for b17 and +0.25 for c12, respectively (red); calculations for −0.2 and +0.2 and shown in green and blue, respectively. Dotted lines correspond to molecular lines only. |
| In the text | |
|
Fig. 4 [S, K/Fe] vs. [Fe/H], plotting the differences between the present results and the APOGEE DR17 values. Error bars correspond to the errors for the cool star b14 reported in Table 2. |
| In the text | |
|
Fig. 5 [P/Fe] vs. [Fe/H] for the present results compared with literature data. Symbols – open red stars: present work, filled red circles: Caffau et al. (2011), open red circles: Caffau et al. (2016), filled blue triangles: Roederer et al. (2014), filled cyan circles and open black circles: Maas et al. (2019), filled light grey circles: Nandakumar et al. (2022), open four-pointed light grey stars: Maas et al. (2022), filled green circles and open black circles: Brauner et al. (2023). Different model lines correspond to the outputs of models computed for radii of r < 0.5, 0.5 < r < 1,1 < r < 2, and 2 < r < 3 kpc from the Galactic centre. Black lines correspond to specific star formation of v =1 Gyr−1, and red lines to v = 3 Gyr−1. |
| In the text | |
|
Fig. 6 [S/Fe] vs. [Fe/H] for the present results compared with literature data. Symbols – open red stars: present work, filled cyan circles: Francois (1987), open red squares: Israelian & Rebolo (2001), filled light grey circles: Chen et al. (2002), four-pointed light grey stars: Korn & Ryde (2005), filled green circles and open black circles: Nissen et al. (2007), filled blue triangles: Spite et al. (2011), open red circles: Caffau et al. (2016), filled orange triangles: Perdigon et al. (2021), open forest green squares: Lucertini et al. (2022). Same as in Fig. 5 for the model lines. |
| In the text | |
|
Fig. 7 [K/Fe] vs. [Fe/H] for the present results compared with literature data Symbols – open red stars: present work, dark green squares: Zhang et al. (2006), filled blue triangles: Andrievsky et al. (2010), filled green squares and open black squares: Reinhard & Laird (2024). Same as in Fig. 5 for the model lines. |
| In the text | |
Current usage metrics show cumulative count of Article Views (full-text article views including HTML views, PDF and ePub downloads, according to the available data) and Abstracts Views on Vision4Press platform.
Data correspond to usage on the plateform after 2015. The current usage metrics is available 48-96 hours after online publication and is updated daily on week days.
Initial download of the metrics may take a while.