Fig. 8.
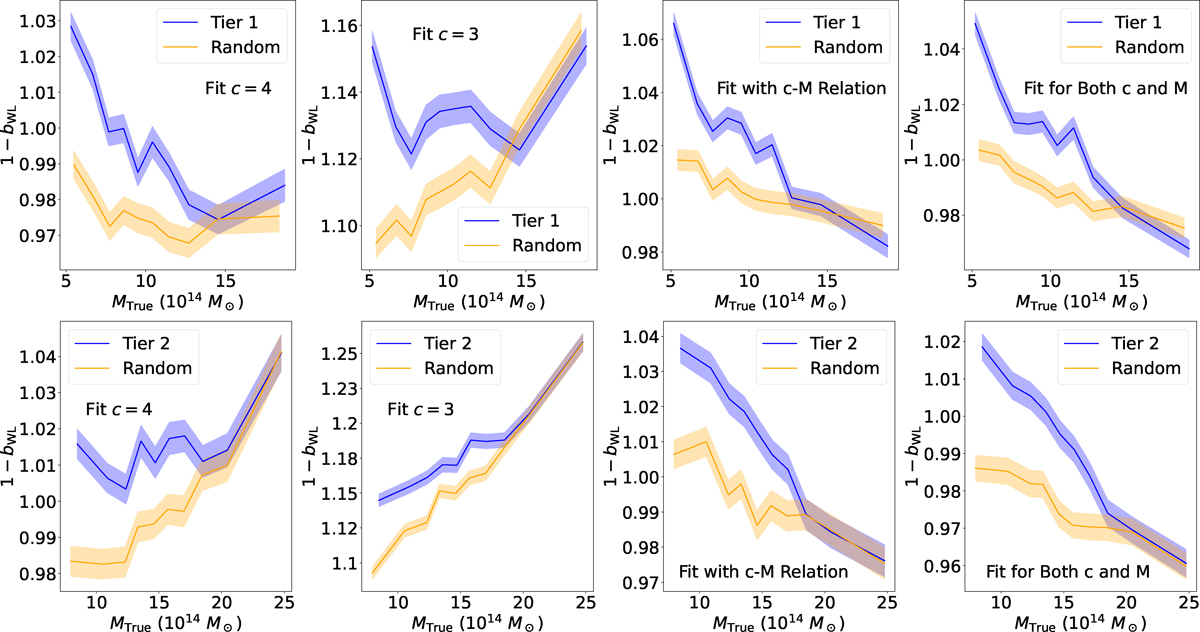
Download original image
Comparison of 1 − bWL as a function of true mass for the mock CHEX-MATE Tier 1 (top) and tier 2 (bottom) selected samples (purple lines and shaded 68% confidence level regions), compared to a random distribution of halos with matched mass and redshift distributions (orange lines and shaded 68% confidence level regions), using varying priors on the value of c200 to obtain MWL from the mock shear data. Left: c200 = 4. Middle left: c200 = 3. Middle right: c200 obtained from the c − M relation of Diemer & Joyce (2019). Right: c200 varied as a free parameter.
Current usage metrics show cumulative count of Article Views (full-text article views including HTML views, PDF and ePub downloads, according to the available data) and Abstracts Views on Vision4Press platform.
Data correspond to usage on the plateform after 2015. The current usage metrics is available 48-96 hours after online publication and is updated daily on week days.
Initial download of the metrics may take a while.