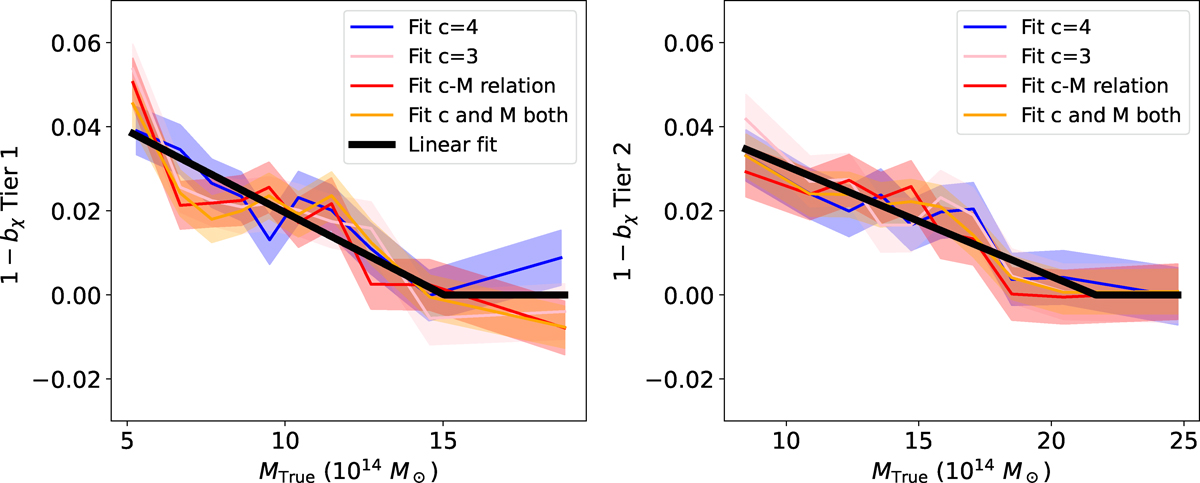
Fig. 9.
Download original image
Ratio of 1 − bWL forCHEX-MATE-selected samples (Left: Tier 1, Right: Tier 2), to 1 − bWL for random samples with matching mass and redshift distributions, defined as 1 − bχ. This plot isolates the bias due solely to orientation in an SZ-selected sample. This orientation bias is approximately independent of fitting methodology, as illustrated by the good agreement between all four choices used in this work. The black line shows a broken linear fit that reproduces the derived values of 1 − bχ to within an rms scatter of 0.003.
Current usage metrics show cumulative count of Article Views (full-text article views including HTML views, PDF and ePub downloads, according to the available data) and Abstracts Views on Vision4Press platform.
Data correspond to usage on the plateform after 2015. The current usage metrics is available 48-96 hours after online publication and is updated daily on week days.
Initial download of the metrics may take a while.