Fig. A.1
Download original image
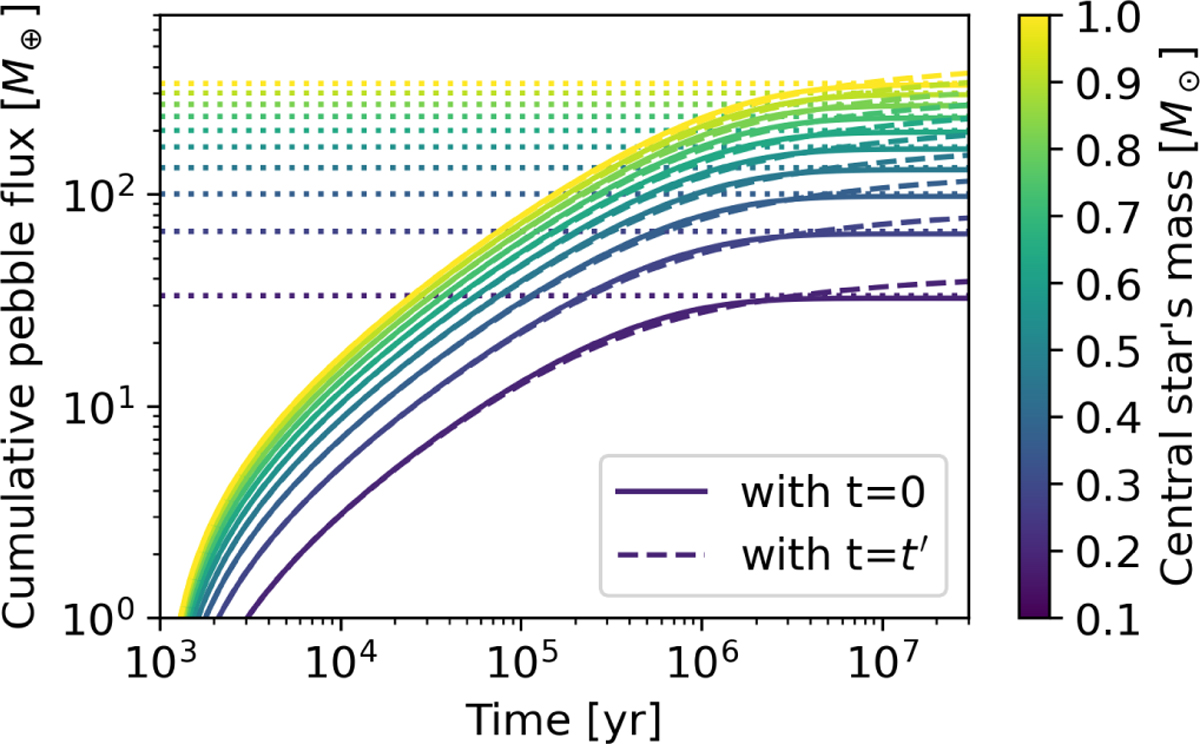
Time evolution of the cumulative pebble flux. The solid lines show the cumulative pebble flux calculated with Eq. 17. The dashed lines are those obtained with Eq. 17 using the time evolving Σgas(t = t′) instead of Σgas(t = 0). The horizontal dotted lines show the initial total mass of solids in the protoplanetary disk. The different colors correspond to disks around different stellar masses.
Current usage metrics show cumulative count of Article Views (full-text article views including HTML views, PDF and ePub downloads, according to the available data) and Abstracts Views on Vision4Press platform.
Data correspond to usage on the plateform after 2015. The current usage metrics is available 48-96 hours after online publication and is updated daily on week days.
Initial download of the metrics may take a while.