Open Access
Fig. B.1
Download original image
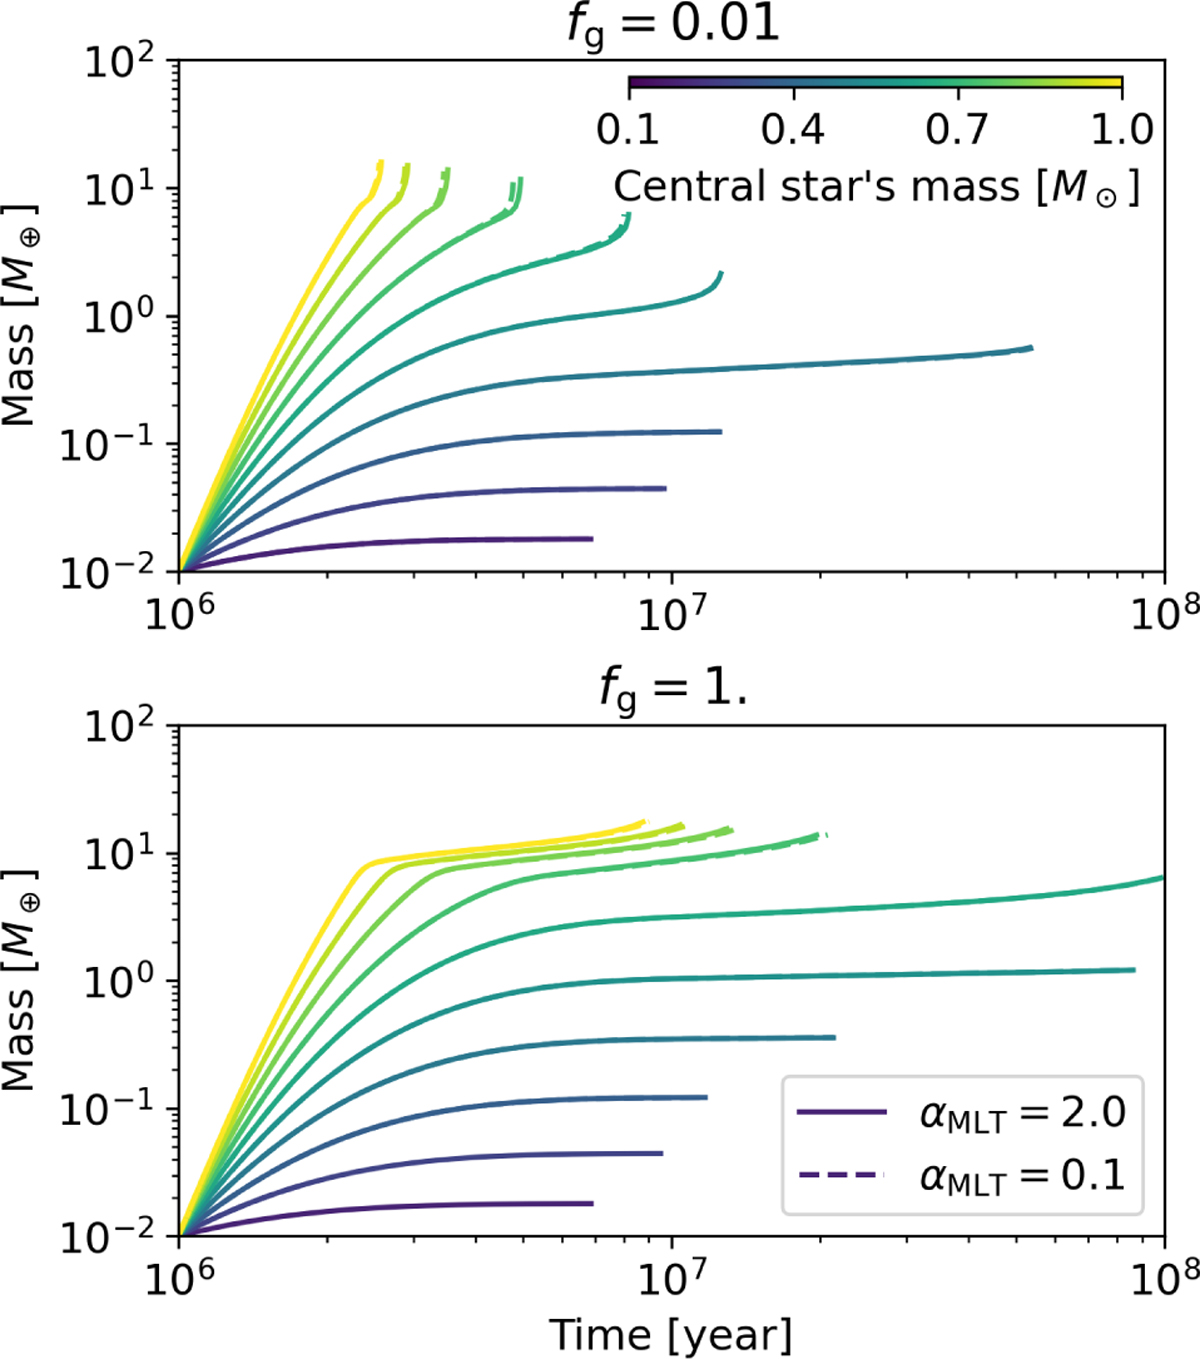
The evolution of protoplanets around different mass stars using different αMLT = 2 (solid lines) and αMLT = 0.1 (dashed lines). The top and bottom panels show the cases with different grain opacity factors fg = 0.01 and 1, respectively. The color corresponds to the stellar mass, as shown in the color bar.
Current usage metrics show cumulative count of Article Views (full-text article views including HTML views, PDF and ePub downloads, according to the available data) and Abstracts Views on Vision4Press platform.
Data correspond to usage on the plateform after 2015. The current usage metrics is available 48-96 hours after online publication and is updated daily on week days.
Initial download of the metrics may take a while.