Fig. 2
Download original image
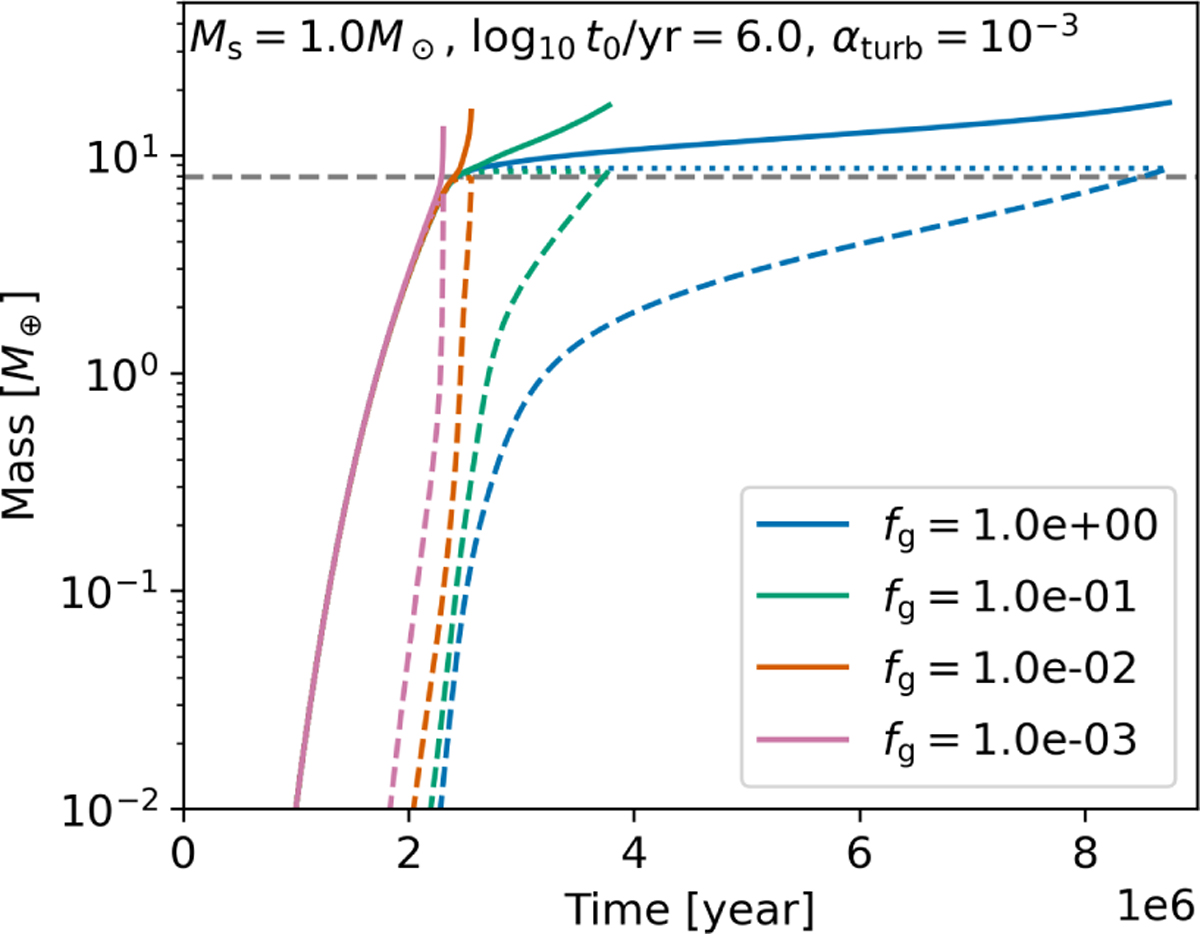
Growth of protoplanets up to crossover mass around 1 M⊙ star with the core formation time t0 = 1 Myrs. Different colors show the cases with different grain opacity fg. The solid, dashed, and dotted lines show the total, envelope, and solid core mass, respectively. The horizontal gray dashed line shows the pebble isolation mass.
Current usage metrics show cumulative count of Article Views (full-text article views including HTML views, PDF and ePub downloads, according to the available data) and Abstracts Views on Vision4Press platform.
Data correspond to usage on the plateform after 2015. The current usage metrics is available 48-96 hours after online publication and is updated daily on week days.
Initial download of the metrics may take a while.