Open Access
Fig. 3
Download original image
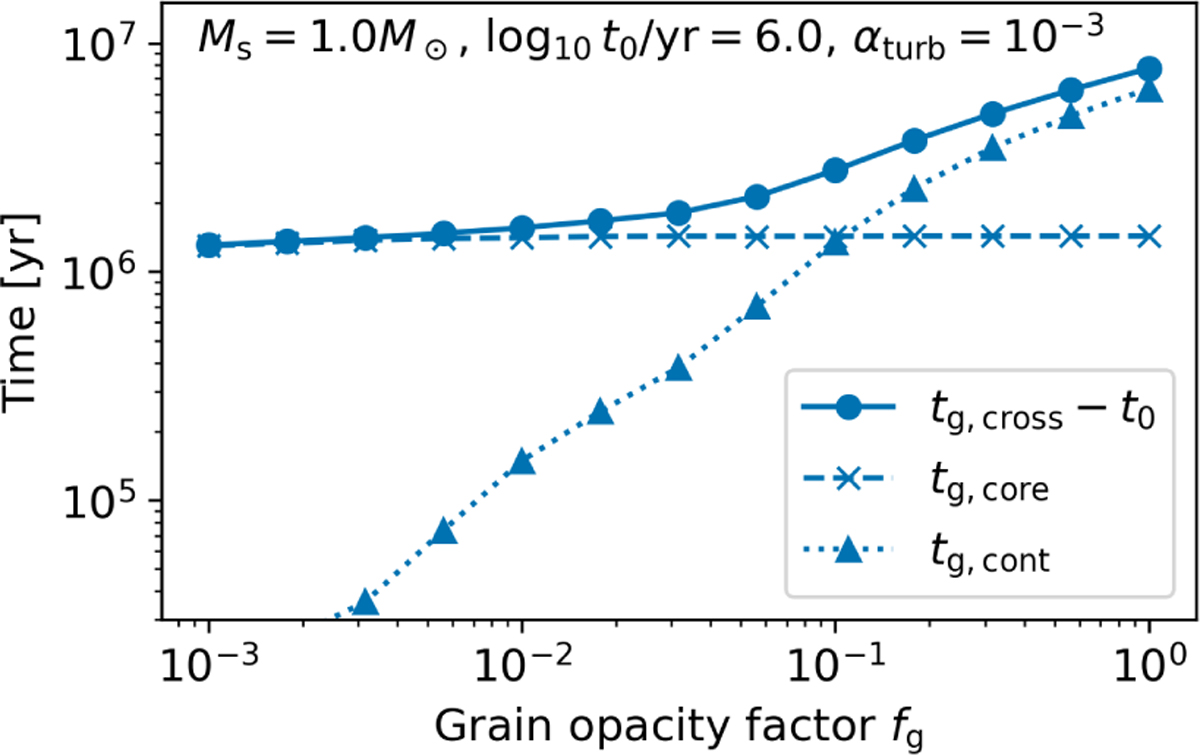
Growth times obtained in the simulations with Ms = 1 M⊙ , t0 = 106 yr, and αturb = 10−3. The solid line shows the crossover time, measured from the core formation time. The dashed and dotted lines show the times required for the protoplanet to grow from M0 to Miso and from Miso to Mcross, respectively.
Current usage metrics show cumulative count of Article Views (full-text article views including HTML views, PDF and ePub downloads, according to the available data) and Abstracts Views on Vision4Press platform.
Data correspond to usage on the plateform after 2015. The current usage metrics is available 48-96 hours after online publication and is updated daily on week days.
Initial download of the metrics may take a while.