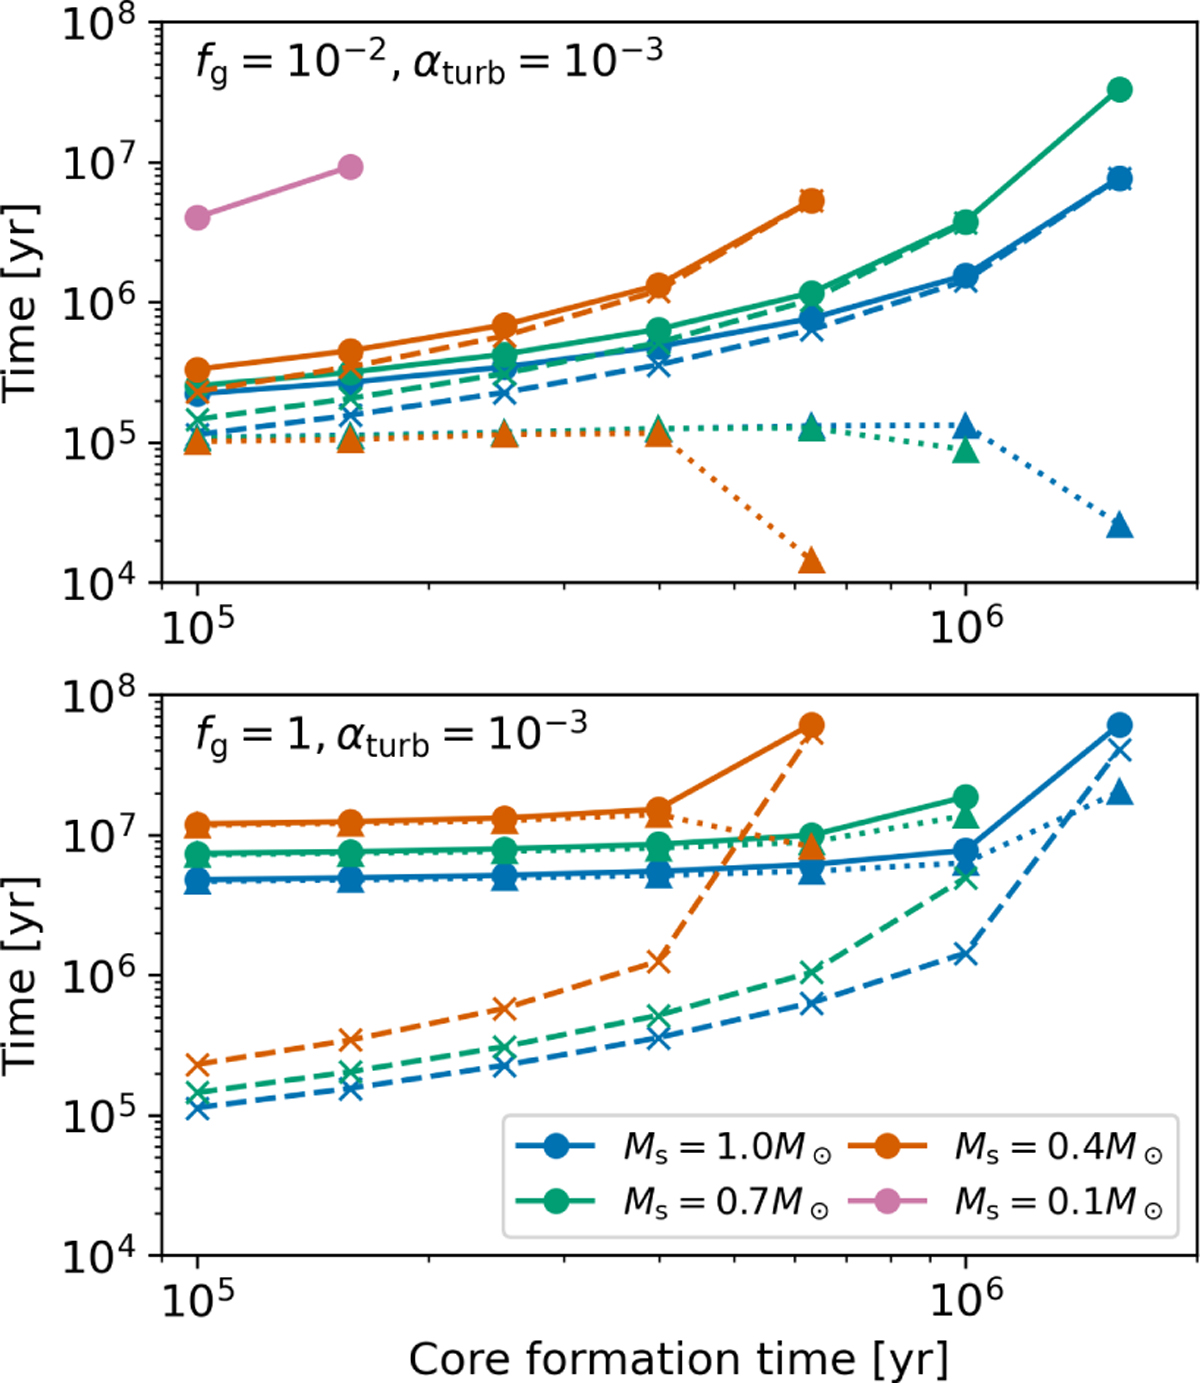
Fig. 6
Download original image
Same as Fig. 3, but for different core formation times t0. The top and bottom panels show the cases with fg = 0.01 and 0.1, respectively. The different colors correspond to different stellar masses. The solid, dashed, and dotted lines show the crossover time measured from the core formation time tg,cross - t0, the core growth time tg,core, and the contraction time tgcont, respectively. Here, we show the cases with αturb = 10−3.
Current usage metrics show cumulative count of Article Views (full-text article views including HTML views, PDF and ePub downloads, according to the available data) and Abstracts Views on Vision4Press platform.
Data correspond to usage on the plateform after 2015. The current usage metrics is available 48-96 hours after online publication and is updated daily on week days.
Initial download of the metrics may take a while.