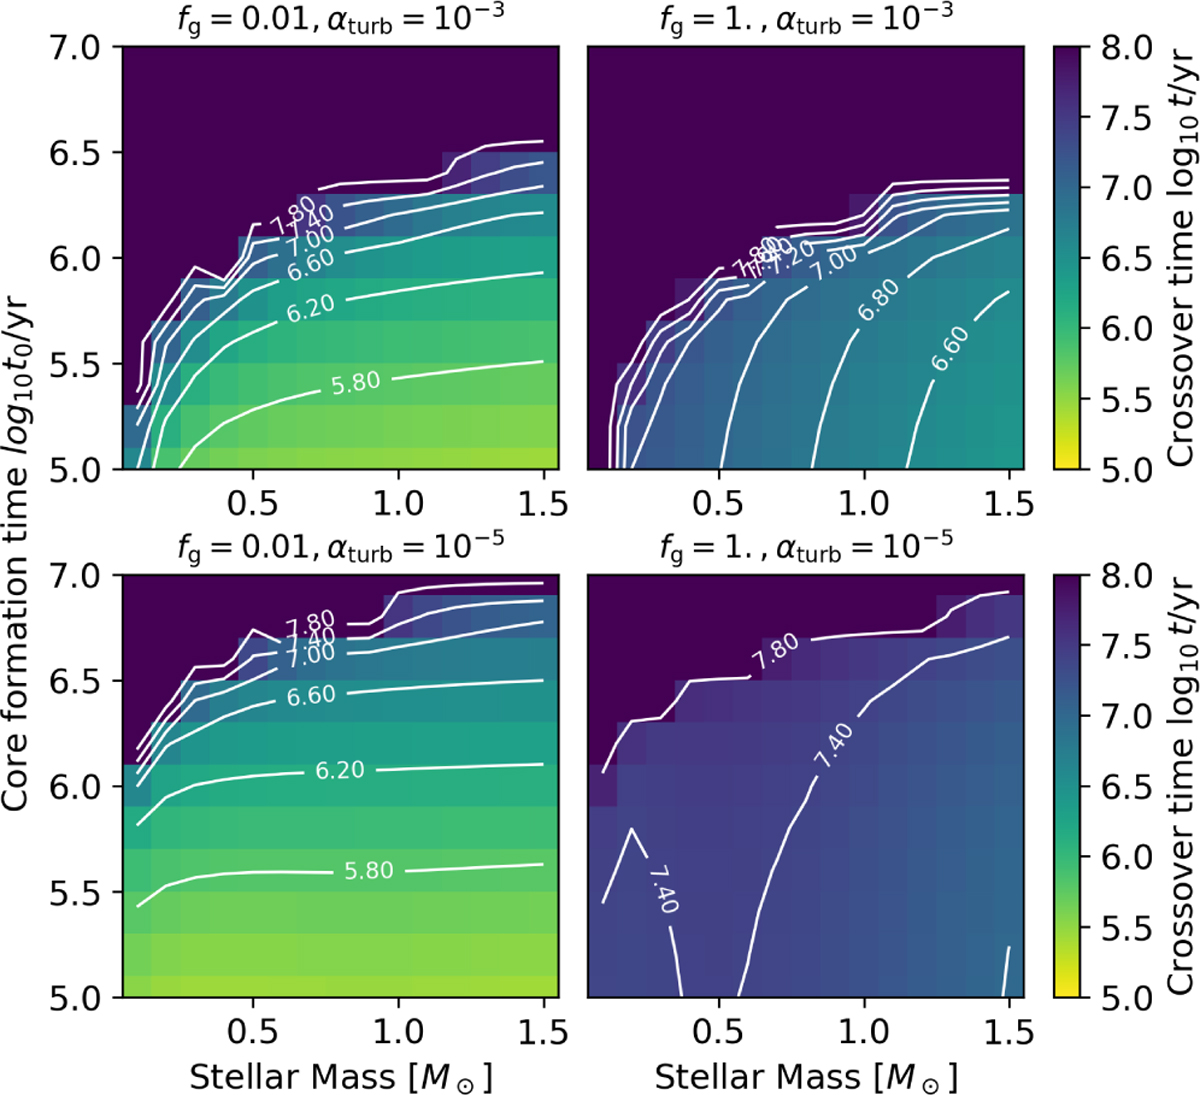
Fig. 7
Download original image
Crossover time obtained from simulations starting with an initial core of Mcore = 0.01 M⊕. We plot the obtained crossover time tg,cross as a color contour, and the color bar is shown on the right side of the panels. The horizontal and vertical axes are stellar mass Ms and the core formation time t0. The black lines show the contour lines and the number on each line shows log10 tg,cross. The left and right columns correspond to the low (fg = 0.01) and high (fg = 1) grain opacity cases. The top and bottom rows show the high (αturb = 10−3) and low (αturb = 10−5) turbulent viscosity cases.
Current usage metrics show cumulative count of Article Views (full-text article views including HTML views, PDF and ePub downloads, according to the available data) and Abstracts Views on Vision4Press platform.
Data correspond to usage on the plateform after 2015. The current usage metrics is available 48-96 hours after online publication and is updated daily on week days.
Initial download of the metrics may take a while.