Fig. 9
Download original image
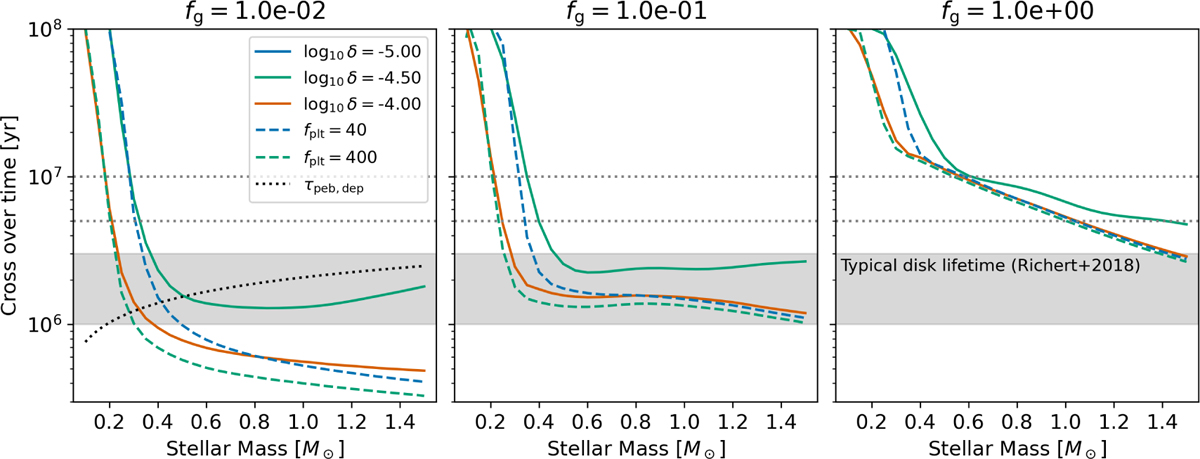
The estimated crossover time in the pebble accretion scenario. The solid and dashed lines show the cases with the planetesimal formation model by Eqs. (24) and (25), respectively. The different colors show the cases with different parameters, as described in the legend box. Each panel shows the cases with different grain opacities. The gray area shows the typical disk lifetime inferred by the observations (Richert et al. 2018), which ranges from 1 to 3 Myrs. We plot the horizontal dotted gray lines at 5 and 10 Myrs for the eye guide.
Current usage metrics show cumulative count of Article Views (full-text article views including HTML views, PDF and ePub downloads, according to the available data) and Abstracts Views on Vision4Press platform.
Data correspond to usage on the plateform after 2015. The current usage metrics is available 48-96 hours after online publication and is updated daily on week days.
Initial download of the metrics may take a while.