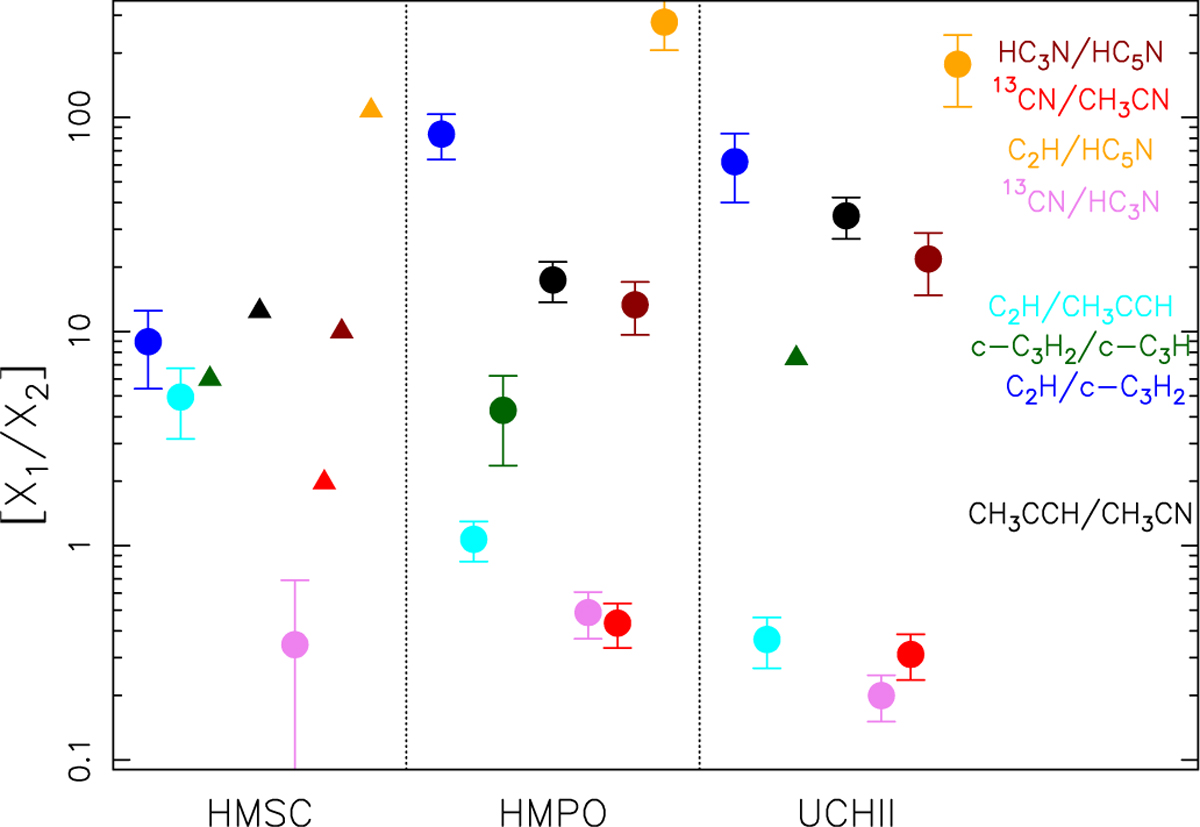
Fig. 11
Download original image
Molecular abundance ratios of chemically related species. As in Fig. 9, hydrocarbons are shown in blue, cyan, and green, and are grouped to the left on the x-axis for each source. containing a cyanide group are indicated in red, orange, and pink. The ratio between the two COMs CH3CCH and CH3CN are indicated in black. Lower limits are indicated by downward-pointing triangles.
Current usage metrics show cumulative count of Article Views (full-text article views including HTML views, PDF and ePub downloads, according to the available data) and Abstracts Views on Vision4Press platform.
Data correspond to usage on the plateform after 2015. The current usage metrics is available 48-96 hours after online publication and is updated daily on week days.
Initial download of the metrics may take a while.