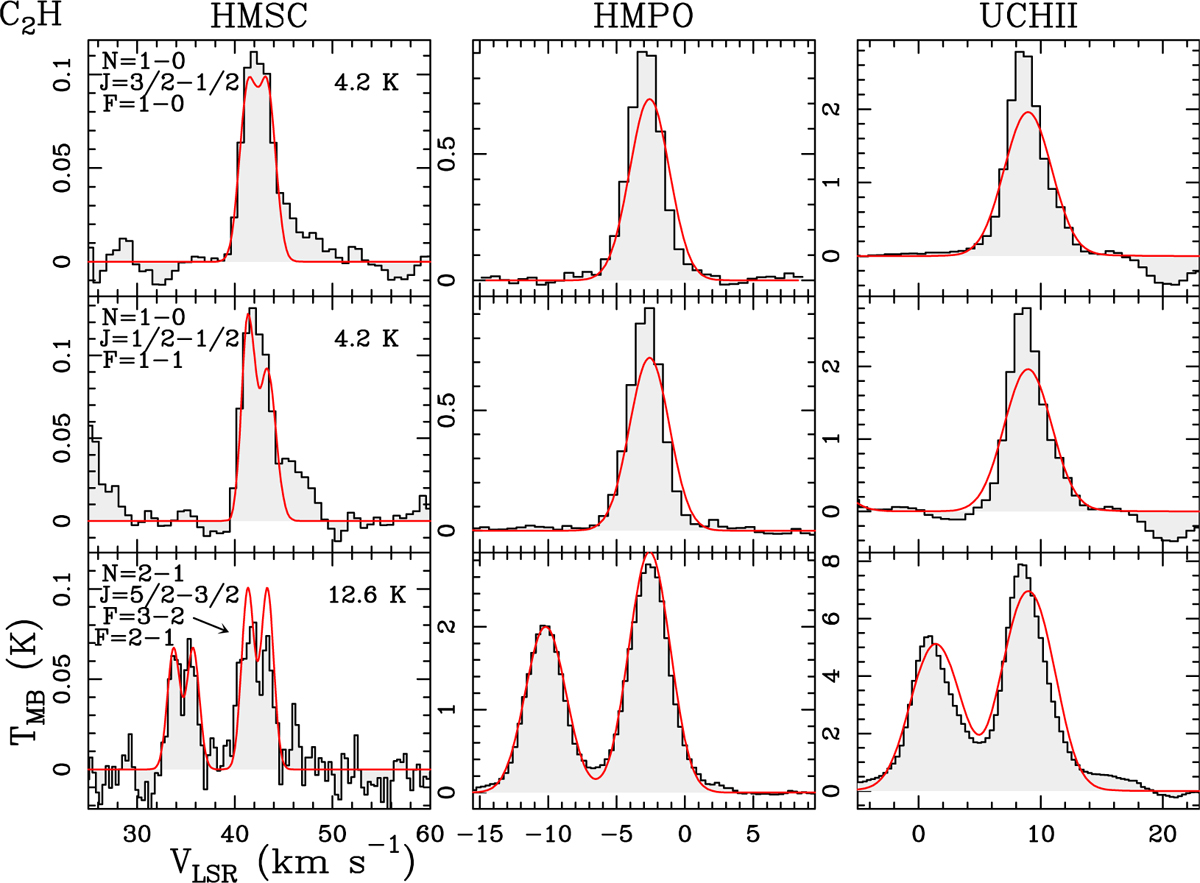
Fig. B.1
Download original image
Spectra of a sample of C2H lines. The red curves are the best LTE fits obtained with MADCUBA. Towards G034, the total fit obtained towards the two velocity components is shown. Quantum numbers and energy of the upper level of the transition are shown in the top left and top right corners, respectively, of the HMSC line plots.
Current usage metrics show cumulative count of Article Views (full-text article views including HTML views, PDF and ePub downloads, according to the available data) and Abstracts Views on Vision4Press platform.
Data correspond to usage on the plateform after 2015. The current usage metrics is available 48-96 hours after online publication and is updated daily on week days.
Initial download of the metrics may take a while.