Fig. 5
Download original image
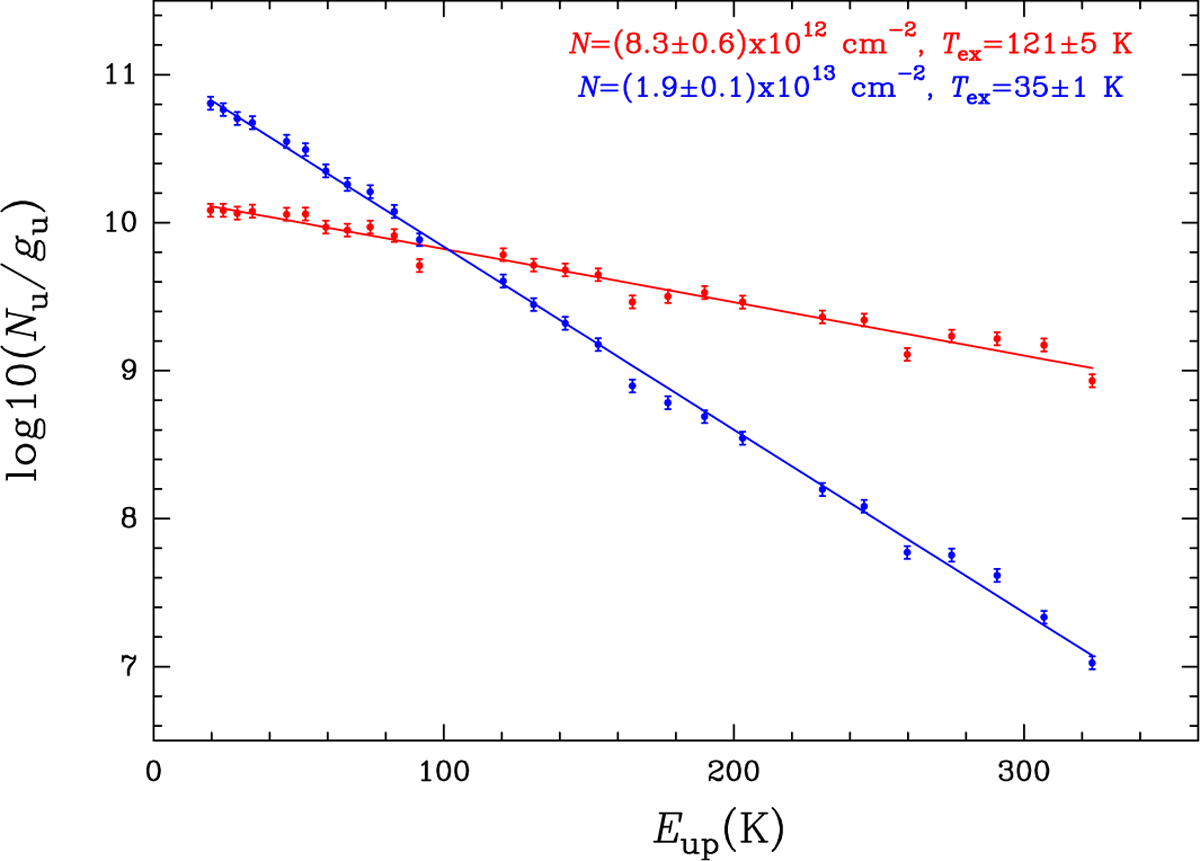
Rotational diagram obtained with MADCUBA towards AFGL (HMPO) from the detected HC3N lines. Blue and red lines indicate the narrow (cold) and broad (hot) velocity features, respectively. The error bars on the y-axis reflect the uncertainties from the fit procedure and the calibration error of 10% on the line integrated intensity.
Current usage metrics show cumulative count of Article Views (full-text article views including HTML views, PDF and ePub downloads, according to the available data) and Abstracts Views on Vision4Press platform.
Data correspond to usage on the plateform after 2015. The current usage metrics is available 48-96 hours after online publication and is updated daily on week days.
Initial download of the metrics may take a while.