Fig. 9
Download original image
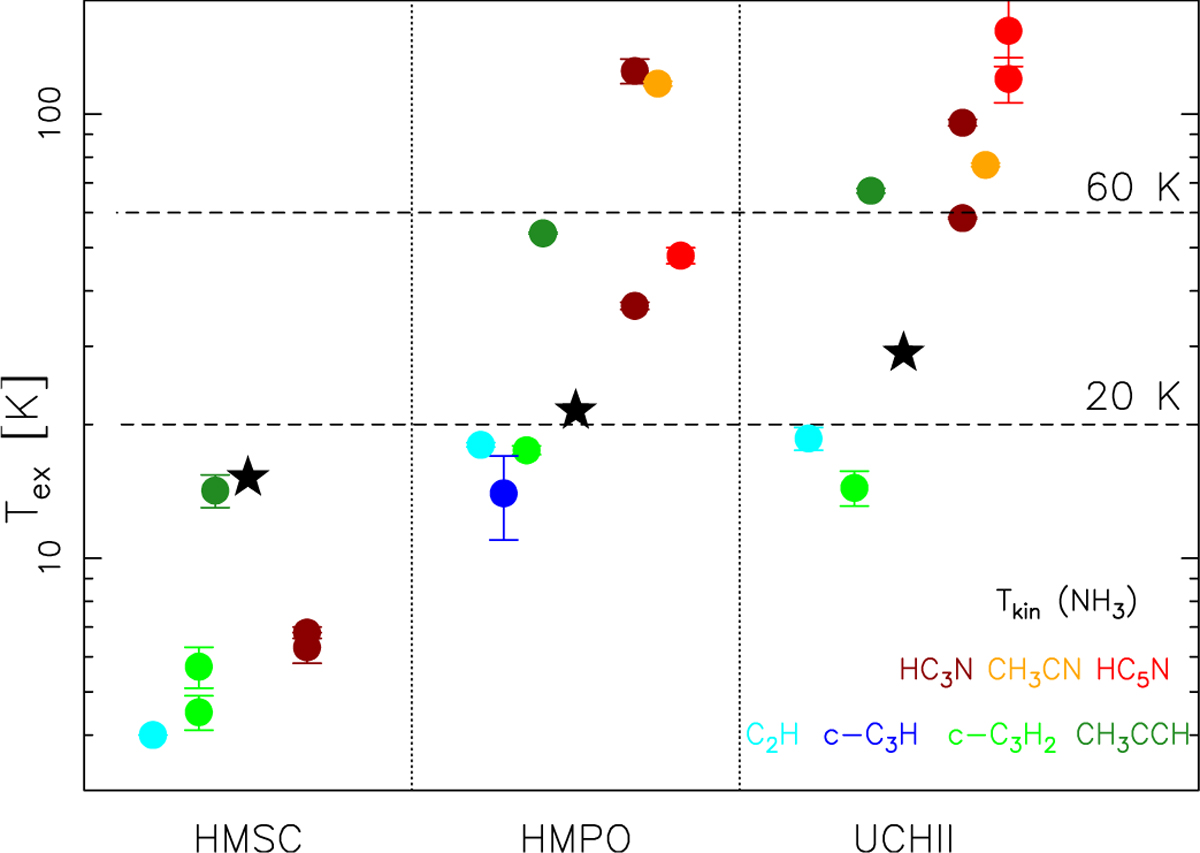
Molecular excitation temperatures. Different colours indicate different species; carbon chains and hydrocarbons are shown in blue, cyan and green and are plotted to the left on the x-axis for each source. Molecules containing the cyanide group are shown in red, orange and pink and are plotted to the right. Black stars indicate the kinetic temperatures as derived from ammonia. For each group, the molecules on the x-axis are ordered from left to right according to increasing number of atoms.
Current usage metrics show cumulative count of Article Views (full-text article views including HTML views, PDF and ePub downloads, according to the available data) and Abstracts Views on Vision4Press platform.
Data correspond to usage on the plateform after 2015. The current usage metrics is available 48-96 hours after online publication and is updated daily on week days.
Initial download of the metrics may take a while.