Open Access
Fig. A.1.
Download original image
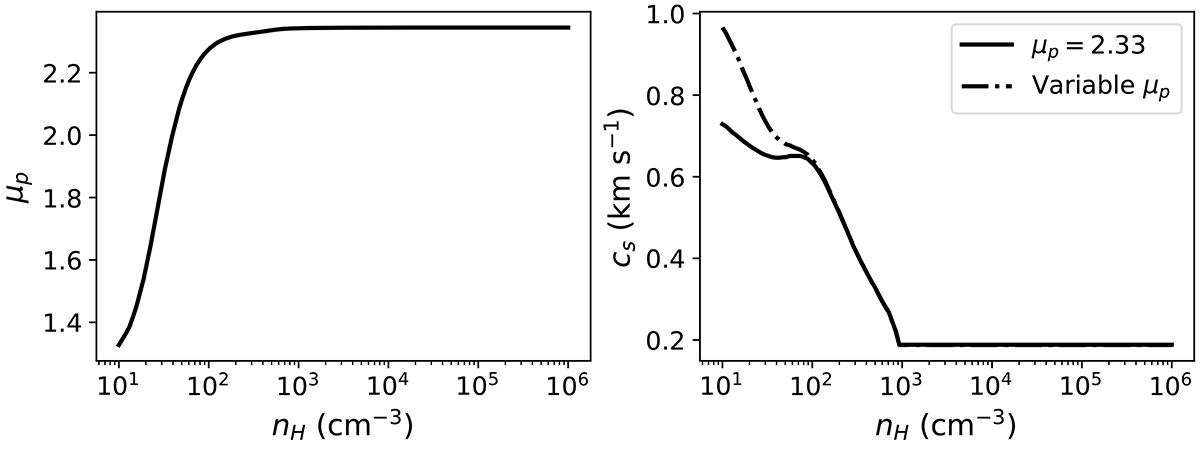
Variation in μp (left) and cs (right) with number density, nH, using one-dimensional models from 3D-PDR. The figure shows cs assuming both a constant μp and a variable μp.
Current usage metrics show cumulative count of Article Views (full-text article views including HTML views, PDF and ePub downloads, according to the available data) and Abstracts Views on Vision4Press platform.
Data correspond to usage on the plateform after 2015. The current usage metrics is available 48-96 hours after online publication and is updated daily on week days.
Initial download of the metrics may take a while.