Open Access
Fig. B.1.
Download original image
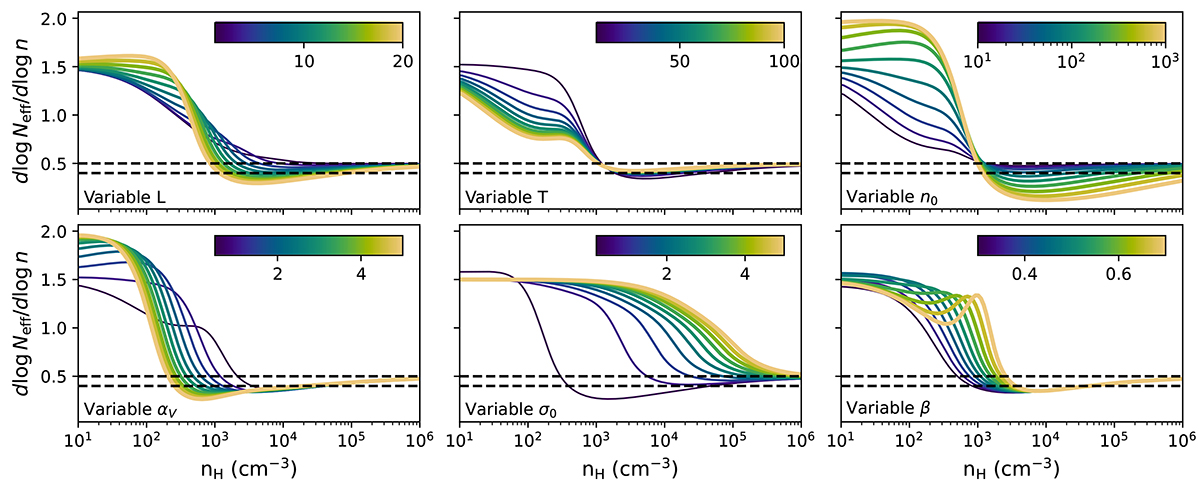
Same as Fig. 3 but showing the derivative, d log Neff/d log n. The horizontal lines show a slope of 0.4 and 0.5, which correspond to the results from hydrodynamic simulation fits (see text) and the isothermal Jeans-only limit.
Current usage metrics show cumulative count of Article Views (full-text article views including HTML views, PDF and ePub downloads, according to the available data) and Abstracts Views on Vision4Press platform.
Data correspond to usage on the plateform after 2015. The current usage metrics is available 48-96 hours after online publication and is updated daily on week days.
Initial download of the metrics may take a while.