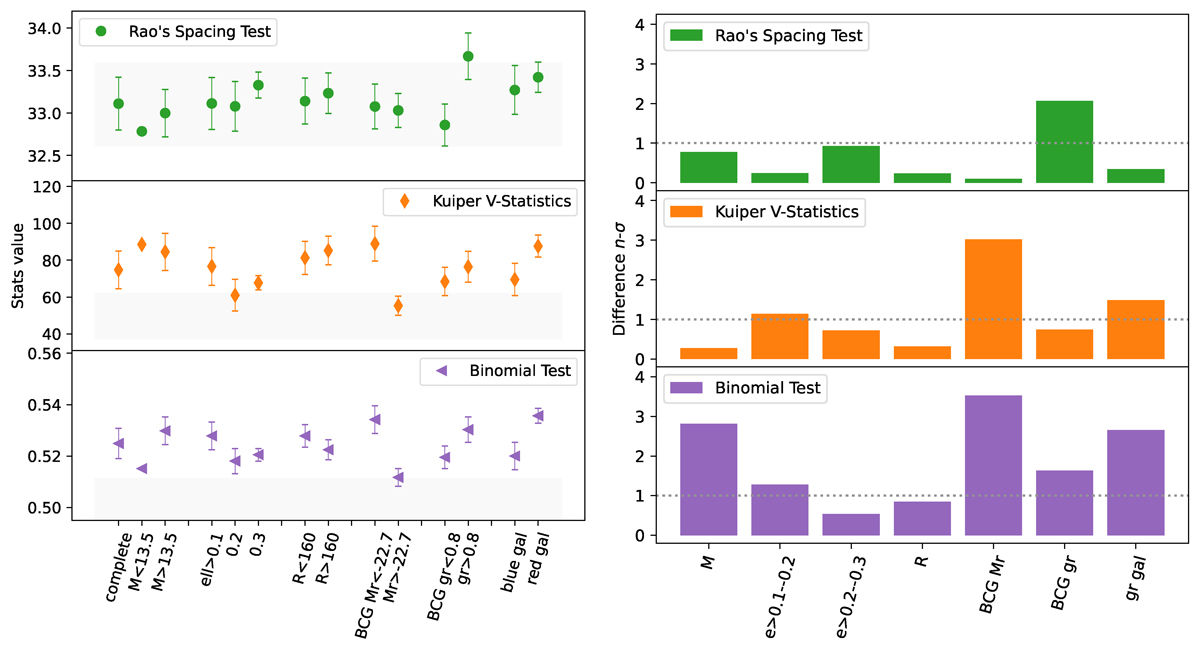
Fig. 4.
Download original image
Left panel: Statistical test values for different subsets, normalised using bootstrapping to allow direct comparison. The grey shaded region shows the 1σ region expected from a uniform distribution. Right panel: Statistical significance of the results compared to uniform simulations. The subsets include the complete sample, BCG ellipticity thresholds (ell > 0.1, 0.2, 0.3), BCG median distance from the cluster centre (R), BCG absolute magnitude relative to the complete sample median in the r band (BCG Mr), BCG colours g_auto-r_auto relative to the median (BCG gr), and the satellite galaxy colour (blue or red gal). The dotted black line indicates the 1σ region.
Current usage metrics show cumulative count of Article Views (full-text article views including HTML views, PDF and ePub downloads, according to the available data) and Abstracts Views on Vision4Press platform.
Data correspond to usage on the plateform after 2015. The current usage metrics is available 48-96 hours after online publication and is updated daily on week days.
Initial download of the metrics may take a while.