| Issue |
A&A
Volume 700, August 2025
|
|
|---|---|---|
| Article Number | A264 | |
| Number of page(s) | 9 | |
| Section | Extragalactic astronomy | |
| DOI | https://doi.org/10.1051/0004-6361/202556043 | |
| Published online | 25 August 2025 | |
SCALE: Using S-PLUS photometric information to analyse the brightest cluster galaxy alignment with satellite galaxies
1
Departamento de Astronomia, Instituto de Astronomia, Geofísica e Ciências Atmosféricas da Universidade de São Paulo, Cidade Universitaria, 05508-900 São Paulo, SP, Brazil
2
Departamento de Fisica, Universidad Tecnica Federico Santa Maria, Avenida España, 1680 Valparaíso, Chile
3
Millenium Nucleus for Galaxies (MINGAL), Chile
4
Observatorio Astronómico de Córdoba, Universidad Nacional de Córdoba, Laprida 854, X5000BGR Córdoba, Argentina
5
CONICET, Instituto de Astronomía Teorica y Experimental (IATE), Laprida 854, Córdoba X5000BGR, Argentina
6
Observatório Nacional – MCTI, Rua Gal. José Cristino 77, Rio de Janeiro 20921-400, Brazil
7
Instituto de Física, Departamento de Física Matemática, Rua do Matão 1371, São Paulo 05508-090, Brazil
8
Laboratório Nacional de Astrofísica (LNA/MCTI), Rua Estados Unidos, 154, Itajubá 37504-364, Brazil
9
Universidade Federal do Rio de Janeiro, Observatório do Valongo, Ladeira do Pedro Antônio, 43, Saúde, 20080-090 Rio de Janeiro, RJ, Brazil
10
Departamento de Física, Universidade Federal de Santa Catarina, Florianópolis, SC 88040-900, Brazil
11
Rubin Observatory Project Office, 950 N. Cherry Ave, Tucson 85719, USA
12
The Observatories of the Carnegie Institution for Science, 813 Santa Barbara St, Pasadena, CA 91101, USA
⋆ Corresponding author: This email address is being protected from spambots. You need JavaScript enabled to view it.
Received:
20
June
2025
Accepted:
21
July
2025
Abstract
Context. Studies of large-scale structures in the Universe reveal that galaxy clusters form in regions of matter overdensity, at the intersection of the filamentary structures that comprise the cosmic web. In this process, satellite galaxies tend to spatially align with the major axis of the brightest cluster galaxy (BCG), a phenomenon influenced by both cluster-scale dynamics and the surrounding large-scale environment.
Aims. In this study we investigated the alignment of satellite galaxies relative to the BCG position angle using photometric data from the fifth data release of the Southern Photometric Local Universe Survey (S-PLUS/DR5) to unveil how galaxies evolve under the influence of both local and global conditions.
Methods. Using three complementary statistical tests, the Kuiper V, binomial, and Rao’s spacing tests, we explored how the alignment signal varies with BCG and cluster properties. Our sample includes 58 galaxy clusters with spectroscopically confirmed BCGs within the STRIPE-82 region, up to a redshift of z < 0.12.
Results. The alignment strength is more pronounced for redder BCGs and brighter BCGs, with the most luminous BCGs presenting the strongest correlation with their satellite distributions. In addition, combining multiple properties, such as BCG colour and luminosity, does not further enhance the alignment signal, as the samples naturally favour BCGs with properties that maximise the effect. Beyond 3 R200, satellite colours become more evolved along the BCG major axis for the reddest BCGs, suggesting preprocessing within large-scale filaments. These findings are further evidence of the role of cluster-scale dynamics and large-scale structure in shaping galaxy alignments.
Key words: galaxies: clusters: general / galaxies: evolution / galaxies: groups: general
© The Authors 2025
 Open Access article, published by EDP Sciences, under the terms of the Creative Commons Attribution License (https://creativecommons.org/licenses/by/4.0), which permits unrestricted use, distribution, and reproduction in any medium, provided the original work is properly cited.
This article is published in open access under the Subscribe to Open model. This email address is being protected from spambots. You need JavaScript enabled to view it. to support open access publication.
1. Introduction
Galaxy clusters are the largest gravitationally bound structures in the Universe, having reached a state of dynamical equilibrium characterised by the virial theorem. According to theory, their formation follows a hierarchical process in which smaller systems collapse first and then merge to form larger structures (White & Frenk 1991). Studies and observations of large-scale structure (LSS) indicate that galaxy clusters occupy privileged positions, acting as nodes in the filamentary cosmic web (Colless et al. 2001).
Galaxies gravitationally bound to clusters are also influenced by the formation and evolution of these structures, often exhibiting a spatial alignment with the major axis (the position angle) of the brightest cluster galaxy (BCG; Jõeveer et al. 1978; Fuller et al. 1999). This alignment effect has been widely studied in the literature since its initial discussion in Sastry (1968); however, the physical origin of this alignment between the BCG and the cluster remains debated.
Recently, three main hypotheses for the origin of BCG–satellite alignment have been addressed (for a review, see Joachimi et al. 2015). The first hypothesis suggests that the primordial alignment of the distribution of matter (baryonic and non-baryonic matter) present at the time of galaxy formation plays an important role in determining the present-day alignment. The second emphasises the influence of mergers and collisions, where gravitational torques act on galaxies, aligning them according to the local tidal field. The third mechanism highlights the presence of large-scale filaments, which transport matter along preferential directions and may strengthen the alignment signal. In reality, these effects cannot be entirely disentangled, and the observed alignments likely result from a combination of all three processes (Smith et al. 2023).
Observations by West (1994) support the first scenario, showing that small variations in the primordial density influence merger activity, resulting in the formation of BCGs and determining their orientation. Later, Wittman et al. (2019) analysed a sample of clusters that underwent major mergers during which structures of comparable mass collided. This study revealed a spatial alignment between the BCG, the cluster shape, and the merger axis, further reinforcing the role of mergers in establishing preferred orientations.
As BCGs are typically located near the cluster centre, they are particularly sensitive to the cluster’s merger history. Using cosmological simulations, Ragone-Figueroa et al. (2020) demonstrate that BCG alignment can either strengthen or weaken depending on the direction of mergers and material accretion, with tidal torques partially reorienting misaligned BCGs. More recently, Rodriguez et al. (2024, 2025) used the TNG300 hydrodynamical simulations (Nelson et al. 2019) to highlight the roles of the assembly process and mergers in shaping their orientation, suggesting a connection between quenching mechanisms and alignment evolution. The significance of the BCG in this context is further emphasised by Niederste-Ostholt et al. (2010), Sifón et al. (2015), West et al. (2017), and Huang et al. (2018), who find that the alignment strength decreases when considering the position angle (PA) of the second-brightest cluster galaxy and disappears entirely for fainter galaxies.
Despite extensive studies, there is still debate in the literature regarding the parameters that influence this alignment. Fuller et al. (1999) found no significant dependence of alignment strength on cluster richness, suggesting that richness is not a decisive factor and would probably arise from the fall of galaxies into clusters along large-scale filaments. In contrast, Niederste-Ostholt et al. (2010), using the sixth Sloan Digital Sky Survey data release (SDSS DR6), reported a stronger alignment signal in richer clusters, an effect related to the merger process that forms the cluster.
The influence of LSS on galaxy orientations was further explored by Argyres et al. (1986) and Lambas et al. (1988), who found preferential alignment extending up to 15 Mpc from the cluster centre. More recently, Chen et al. (2019) report that this effect persists up to 40 Mpc, even in the absence of nearby clusters. These findings emphasise the correlation between cluster shape and the surrounding large-scale environment, with matter distribution playing a significant role in determining the alignment strength.
The dependence of alignment on BCG, galaxy, and cluster properties is also debated. Using SDSS DR7, Huang et al. (2016) analysed multiple factors, including cluster mass, morphology, richness, and BCG properties, finding that the BCG shape is a key determinant of the alignment strength. This result is consistent with Smith et al. (2023), who highlight the BCG shape and distance to the filaments as key factors in strengthening the alignment effect. However, Rodriguez et al. (2022), using SDSS DR16 data, find no significant correlation with BCG shape or cluster mass, instead identifying BCG colour as a relevant parameter. Since observational biases related to the filter system could also influence PA measurements and affect alignment strength, Georgiou et al. (2019) analysed spectroscopic data from the Galaxy And Mass Assembly (GAMA) survey and found no dependence on observation bands, although their results also point to galaxy colour as an important factor.
In this study, our aim was to further explore the factors influencing galaxy alignments, focussing on the role of galaxy colours and environmental effects. We used accurate photometric redshifts from the Southern Photometric Local Universe Survey (S-PLUS; Mendes de Oliveira et al. 2019). Our analysis focusses on the STRIPE-82 region due to its extensive spectroscopic coverage, including within the expected 9300 square degrees of S-PLUS. This dataset provides an excellent testing ground for our methods and allows us to explore photometric information, benefiting from the depth of the S-PLUS survey down to r = 21 mag. This mitigates concerns related to spectroscopic incompleteness in magnitude and cluster-centric distance (Poggianti et al. 2006; Olave-Rojas et al. 2018). Furthermore, with the aid of spectroscopic data, we securely identify the BCGs in our sample – a crucial step, as alignment strength tends to decrease when fainter galaxies are considered.
This paper is organised as follows. Section 2 describes the galaxy catalogue and selection of the cluster sample. Section 3 outlines the statistical techniques for alignment measurement and describes the simulations of uniform distributions used for comparisons. Section 4 presents our main findings, including the optimal redshift bin, alignment measurements, parameter combinations, and the influence of the LSS environment. Finally, Sect. 5 discusses and summarises our results.
We adopt a flat Λ cold dark matter cosmology for distance measurements, with H0 = 68 km s−1 Mpc−1 and Ωm = 0.31, in agreement with Planck Collaboration XIII (2016) parameters. Magnitudes are given in the AB system.
2. Data
In this section we describe the data used in this work, including the galaxy cluster catalogue and galaxy properties. Although the fifth internal data release of the S-PLUS covers more than 4600 square degrees of the sky, in this work we focused on the STRIPE-82 region due to its extensive coverage by other surveys.
2.1. Galaxy sample
S-PLUS (Mendes de Oliveira et al. 2019) is a photometric survey designed to cover more than 9000 square degrees of the southern sky using 12 filters, including five broad bands and seven narrow bands. Observations are conducted with the 80-cm T80-South telescope, located at the Cerro Tololo Inter-American Observatory (CTIO) in Chile. Each image covers a field of view of 1.4 × 1.4 square degrees for a total of 2 square degrees.
In its fifth internal data release (Lima et al., in prep.), which will become public in August 2025, the survey delivers the photometry for ∼4600 square degrees. Studies by Lima et al. (2022) revealed that objects with r-band magnitudes fainter than 21.3 present a photometric redshift precision of σNMAD, z = 0.019, which improves to σNMAD, z = 0.006 for objects with r ≤ 17.5. These values demonstrate the high quality and precision of the estimated photometric redshifts.
The PA and ellipticity used in this work were obtained from the S-PLUS calibration pipeline, which is based on the SExtractor software (Bertin & Arnouts 1996), using the Kron aperture. The PA is derived from the second-order moments of the light distribution, which characterise the shape of the galaxy’s brightness profile. Specifically, the PA corresponds to the orientation of the semi-major axis of the best-fitting ellipse, measured counterclockwise from north. As the S-PLUS catalogue reports PA measured from the east (as defined by the THETA parameter), we converted it to match the standard convention. Further details on the calibration pipeline are available in Herpich et al. (2024). Although the shape and orientation of the galaxy can vary depending on the choice of aperture radius, Huang et al. (2016) has shown that different measurement methods yield consistent results, with variations typically within ±0.09°1. Potential measurement uncertainties in PA and ellipticity are not considered here.
Our analysis focusses on the STRIPE-82 region (−60° < α < 60°, −2° < δ < 2°). We selected objects brighter than r = 21, ensuring a complete sample. To minimise possible contamination by stars and artificial sources, we cross-matched the data with the spectroscopic compilation of objects in the southern hemisphere produced by de Lima (2024), retaining only those with the spectral class ‘GALAXY’. For objects without a spectroscopic counterpart, we selected those identified as a galaxy using a machine learning approach specifically calibrated for the S-PLUS survey, as detailed in Nakazono et al. (2021). Absolute magnitudes and colours were corrected for extinction and k-corrections following an approach calibrated for the S-PLUS, detailed by O’Mill et al. (2011) based on Blanton & Roweis (2007).
2.2. Galaxy cluster catalogue
Our sample consists of approximately 12 000 galaxy clusters and groups detected in the STRIPE-82 region (Doubrawa et al., in prep.). The cluster catalogue was produced with the density-based algorithm PZWav (Gonzalez 2014; Doubrawa et al. 2024), a cluster finder designed to identify galaxy overdensities in a range of redshifts.
Briefly, PZWav searches for galaxy overdensities in a series of redshift slices using fixed physical scales that correspond to typical sizes of galaxy groups and clusters (within 0.4 and 1.4 Mpc). The algorithm generates two-dimensional density maps for each redshift slice (Δz = 0.01), weighting each galaxy’s contribution by the integral of its photometric redshift probability density function within the redshift slice limits. Noise is estimated using a secondary density map based on the distribution of peaks found in the previous step. Cluster centres are defined as the locations of the overdensity peaks, while cluster redshifts are taken as the median redshift of galaxies within a 500 kpc radius. Candidates are selected if they have a signal-to-noise ratio greater than 4.
To ensure the precision of our detections and obtain reliable mass and radius estimates, we matched our catalogue with the spectroscopically selected sample from Lim et al. (2017), in which masses were assigned to galaxy groups using proxies based on the luminosity of the member galaxies. A match was defined as having a central distance below 500 kpc and a redshift difference Δz < 0.05, criteria consistent with other studies that consider matching catalogues (as in Werner et al. 2022; Maturi et al. 2023; Doubrawa et al. 2024).
Initially, we identified 150 correspondences between photometric and spectroscopic selected clusters. However, to study galaxy alignment, it is necessary to avoid systematic effects that can introduce false signals. To reduce incompleteness in the galaxy sample due to survey boundaries, we removed clusters and groups whose centres lie closer than three times the R200 to the edge of the survey footprint. Here, R200 denotes the radius encompassing 200 times the mean density of the Universe. Additionally, since the presence of nearby clusters and groups can also interfere with the signal measurement, we excluded systems with known massive neighbours (above 1013 M⊙) within 3 R200.
After applying these selection criteria, our final sample comprises 58 galaxy clusters and groups. Their masses range from 1013 to 1014.5 M⊙, with 84% (49 clusters) having masses below 1014. The redshifts vary from 0.036 to 0.11, with 60% (34) at z < 0.07.
3. Methods
In this section we define the alignment of the galaxies relative to the BCG PA, the statistical tests employed to quantify the alignment, and how to calculate the significance of the observed alignment obtained through simulations.
3.1. Alignment with the BCG
The methodology used in this work follows the principles outlined by Smith et al. (2023): we measured the galaxy alignment by calculating the angular distance (θ) between the direction of the BCG PA and the sky position of each galaxy measured from the centre of the cluster, as illustrated in Fig. 1. To measure the strength of alignment, we stacked multiple clusters. Before stacking, each system was rotated so that the BCG PA is aligned horizontally, ensuring a consistent frame of reference across all clusters. As the theory predicts that the galaxy distribution is preferentially orientated with the BCG PA, this process enhances the alignment signal, increases the number of galaxies in question, and averages out noise that can be present on the individual clusters, thereby improving the statistical significance of the result.
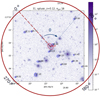 |
Fig. 1. Illustration of the angular distance (θ) between the BCG orientation and the n-th galaxy’s sky position. In this example, the BCG coincides with the cluster centre, although this is not always the case. |
Since the angular distances range from 0 to 360°, we converted them into the range 0 to 90°, without compromising the analysis. This transformation is based on the symmetry around the BCG PA. For example, an object at θ = 180° has the same alignment as an object at θ = 0° relative to the BCG. Similarly, objects positioned perpendicularly to the BCG PA remain consistent in this transformation.
For this study, we analysed galaxies within 3 R200 of the cluster centre, a limit set by the STRIPE-82 coverage. In future work, we will extend this analysis to larger radii using the full S-PLUS survey. Galaxies are selected within a redshift difference of Δz = 0.025 from the cluster’s centre without distinguishing between cluster members and field galaxies. The influence of the choice of the redshift bin is discussed in Sect. 4.1.
3.2. Statistical methods
Following West et al. (2017) and Smith et al. (2023), we used the Kuiper V, binomial, and Rao tests to quantify the galaxy alignment. These tests assess if the angular separation deviates from a uniform distribution without requiring arbitrary binning, each providing a complementary perspective on the alignment signal.
3.2.1. Kuiper’s V test
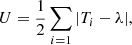
Kuiper’s V test, based on Kuiper (1960), measures the maximum and minimum of the cumulative distribution of observed angular separation concerning a uniform distribution. For that, the angles are sorted into increasing order. The test statistic is calculated as
 (1)
(1)
where D+ is the maximum positive deviation and D− is the maximum negative deviation of the cumulative distribution of uniformity. A higher value indicates that the galaxies are more distributed in a preferential direction.
Since this statistic is not normalised, its distribution depends on the number of galaxies in the sample. When comparing samples of different sizes, we used a Monte Carlo resampling to randomly down-sample the larger dataset to match the smaller one. The error bars in our results represent the standard deviation from repeating this resampling process a thousand times.
3.2.2. Binomial test
The binomial test is a simple method that quantifies the fraction of galaxies with angular separation of less than 45° from the BCG major axis. Under the hypothesis of a uniform distribution, this fraction should be equal to 0.5. If the fraction is greater than 0.5, it indicates a preferential distribution in agreement with the BCG PA, while values lower than 0.5 suggest an anti-correlation trend.
3.2.3. Rao’s spacing test
Based on Rao (1976), Rao’s spacing test evaluates the angular offset between successive galaxies and compares it to the expected value from a uniform distribution. This approach is particularly effective in detecting non-uniform clustering patterns. For this, it is also required that the angles obtained be sorted in increasing order.
The expected angular variation, λ, is calculated as
 (2)
(2)
with N being the number of galaxies in the stacked sample. Then, the test statistic is computed by calculating the sum of the offsets,
 (3)
(3)
where Ti = θi + 1 − θi for i < N and Ti = (90 − θN)−θ1 for i = N.
Although using Monte Carlo for a fair comparison between results, caution must be taken to avoid repeated values of θ inconsistent with the data, as consecutive identical angles could artificially enhance the alignment signal. Note that, due to the test definition, it quantifies the uneven distribution of the data rather than directly measuring the galaxies’ orientation.
3.3. Measurement of sample uniformity
To evaluate the non-uniformity of our samples, we compared the observed alignment results with those expected from uniformly distributed particles. We define ‘non-uniformity’ as the number of standard deviations by which the observed values deviate from the mean of the simulated distributions.
Although the aim is for a uniform distribution, if the number of particles is relatively small, the values of the statistical tests described above can oscillate around the mean. Then, to measure how much it deviates, we created a thousand randomly distributed datasets that reproduce a stacked image varying from 200 to 25 000 galaxies. For each realisation, we computed the mean and standard deviation values of the test statistics, providing a benchmark for comparison with observations. We show the results in Fig. 2.
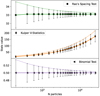 |
Fig. 2. Mean and standard deviation of the statistical values from the Kuiper V, binomial, and Rao tests, obtained from simulations of uniformly distributed particles. The solid and dashed lines represent interpolated values for the expected results. |
As simulating all possible combinations of a given number of galaxies is unfeasible, we interpolated the expected values for both the mean and errors using the package interp1d from scipy, allowing for a continuous estimate for any given sample size. We considered the strengthening of the alignment signal between subsamples to be significant if at least two of the applied statistical tests show differences larger than 1σ, and if the comparison with the uniform simulation also exceeds the 1σ level.
4. Results
In this section we present our main results. We discuss the importance of choosing the correct photometric redshift bin to select the data as a way to increase the signal strength, the alignment, and conditions that improve the signal, and a correlation between the satellite colour distribution and its connections to the LSS of the Universe.
4.1. Photometric redshift bin
Studies of galaxy alignment are usually based on spectroscopically confirmed objects and use only galaxies selected as members of the structures in use. However, using photometric data allows for larger and more complete samples, including low-brightness galaxies.
Although photometric redshifts have lower resolution than spectroscopic ones, the ongoing and forthcoming wide photometric surveys are projected to combine broad- with several narrow-band filters, which will allow the observation of millions of objects with errors limited to σz ∼ 0.01 (1 + z). Even with small associated errors in the redshift measurements, photometric studies still require more caution regarding the presence of foreground and background objects, as the presence of outliers can contaminate the sample and decrease the alignment signal. Here, we show that choosing an optimal redshift bin to select photometric galaxies can enhance the signal strength.
To do this test, first, we selected all galaxies within 3 R200 of the cluster centre and with photometric redshifts within a given Δz centred in the cluster redshift (zcl ± Δz). We then computed the test values for different redshift slices. The smallest interval corresponds to the σNMAD derived by Lima et al. (2022) for the cluster median redshift (0.065), and we increased Δz by 0.005 in each subsequent step. Figure 3 shows the non-uniformity of the three statistical measurements, Rao’s spacing test (green), Kuiper V (orange) and binomial (purple), using the complete cluster sample, for each photometric slice. Hereafter, we use the same colour code to represent each statistical test. The slice that best enhances the measurements for the three statistical tests is 0.025, with a non-uniformity of 0.6, 4.9, and 3.8σ for the Rao, Kuiper, and binomial tests, respectively.
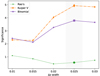 |
Fig. 3. Results of non-uniformity tests for different photometric redshift widths (Δz), used to determine the optimal selection aperture. Rao’s spacing test (green), Kuiper’s V test (orange), and the binomial test (purple) are shown. |
Although wider bins could increase the values, they reach the redshift limit of the galaxy sample. Additionally, we would increase the contamination of foreground and background galaxies. Therefore, we assumed 0.025 as the fiducial slice for the analysis of the subsamples and parameter combination.
4.2. Galaxy alignment
We tested a set of different constraints on the data to investigate the effects of each choice of BCG and satellite properties that strongly strengthen the tendency for the satellite galaxies to lie along the BCG major axis, that is, the alignment signal. Here, we show results with the complete sample (complete), low- and high mass-clusters (13 < M < 13.5 M⊙, M > 13.5 M⊙)2, BCG ellipticity (ell > 0.1, 0.2, 0.3), BCG median distance from the galaxy density peak (cluster centre, R in kpc), BCG absolute magnitude larger or smaller than the median in the r band (BCG Mr), BCG colours g_auto-r_auto larger or smaller than the median (BCG gr), and the separation of the satellite in g − r colour (blue or red galaxy).
The left panel of Fig. 4 shows the median values obtained from each statistical test using the bootstrapping technique, allowing direct comparison. To aid in the interpretation of these results, the right panel of Fig. 4 presents the corresponding difference between the values obtained for each complementary subsample. As a supporting analysis, we report the deviation of the median values from uniformity in Fig. 5.
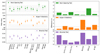 |
Fig. 4. Left panel: Statistical test values for different subsets, normalised using bootstrapping to allow direct comparison. The grey shaded region shows the 1σ region expected from a uniform distribution. Right panel: Statistical significance of the results compared to uniform simulations. The subsets include the complete sample, BCG ellipticity thresholds (ell > 0.1, 0.2, 0.3), BCG median distance from the cluster centre (R), BCG absolute magnitude relative to the complete sample median in the r band (BCG Mr), BCG colours g_auto-r_auto relative to the median (BCG gr), and the satellite galaxy colour (blue or red gal). The dotted black line indicates the 1σ region. |
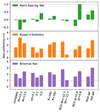 |
Fig. 5. Comparison between the median values from Fig. 4 and the expected uniform distribution from simulations. The values indicate how many sigma the distribution deviates from uniformity. The dotted black line indicates the 1σ region. |
We began our analysis with the mass of the structures. The figures indicate that lower-mass systems show slightly higher values for Kuiper V than higher mass systems, while the binomial test results show an inverted trend. All three tests fall within the error bars, with only the binomial test showing a statistically significant difference, reaching 2.7σ. This suggests that mass, at least within systems in the group scale, is not a dominant factor for the angular segregation of the satellite galaxies relative to the BCG major axis, which is consistent with the findings by Rodriguez et al. (2022). Interestingly, both the low- and high-mass subsamples deviate significantly from a uniform distribution. For lower-mass systems, the non-uniformity reaches 3.2σ in Kuiper V and 1.3σ in the binomial test. For higher-mass systems, the deviations are 2.2σ and 2.4σ, respectively. These values may reflect the influence of filamentary structures that continuously feed matter into galaxy clusters and groups.
Ellipticity is a complex parameter as it depends on the resolution of the survey, the measurement method (e.g. isophotal, Kron or Petrosian radii), and associated observational uncertainties. Additionally, determining a reliable PA becomes increasingly difficult for rounder galaxies. To investigate the correlation between BCG ellipticity and the alignment signal, we applied three lower limits on ellipticity: 0.1, 0.2, and 0.3. Although a slight decreasing trend is observed in the statistical test values, the results remain consistent within the error bars. In terms of difference, the ell > 0.1 value is only ∼1.3 times larger than ell > 0.2 for both the Kuiper V and binomial tests. Due to the overall formation history for structures, elongated BCGs are often associated with frequent mergers along preferred directions, a process that is expected to contribute to stronger alignment signals. However, when applying the stricter cut of ell > 0.3, we observe only a modest increase in signal strength compared to the ell > 0.2 case. Our findings suggest that even relatively round BCGs can exhibit a significant alignment signal. This may be partly due to the reduced number of sources with high ellipticity (34% of the sample), limiting the statistical power of the test. Given the apparent non-linear dependence between ellipticity and alignment signal, we conclude that ellipticity is not a dominant factor, a result that diverges from the findings by Smith et al. (2023). Considering the non-uniformity, the ell > 0.1 sample shows values comparable to the complete sample (as only six systems fall below this threshold), while the ell > 0.2 subset shows a slight decrease in Kuiper V significance, at only 0.8σ.
The projected distance between the BCG and the cluster centre can be used as an indicator of the system’s dynamical state. A significant offset may indicate a disturbed surrounding environment, possibly due to a recent merger event. For such a scenario, the BCG would need ∼1 Gyr to reassume its central position, potentially weakening the alignment signal (this timescale can vary depending on the merger configuration; e.g. Ragone-Figueroa et al. 2020). In our analysis, the statistical test values are consistent across the subsets, with only a small increase in the binomial test (0.9σ) for BCGs located closer to the centre. Since our initial sample was selected by excluding systems with nearby groups and clusters, it is biased towards more relaxed structures. Consequently, the central distance does not appear to be a dominant factor in this context.
Brightest cluster galaxy luminosity is a very interesting parameter. Luminous BCGs are usually found closer to the centre of the potential well of the cluster, and are likely less affected by miscentring effects (Wen et al. 2012; Huang et al. 2016). Additionally, they are commonly associated with more relaxed environments and thus, even after experiencing the influence of the surrounding large-scale field through mergers, they had sufficient time to reorient into the cluster tidal fields. Here, all statistical tests show stronger alignment signals for the brightest BCGs compared to the fainter ones, with differences of 0.1σ in Rao’s spacing test, 3.1σ in Kuiper V, and 3.5σ in the binomial test. Note that the non-uniformity figure also reflects this trend, reaching 2.5 and 2.8σ for Kuiper V and binomial, respectively, for Mr < −22.7, and 0.5 and 1σ for Mr > −22.7. Therefore, the BCG luminosity is one of the most dominant indicators of galaxy alignment.
Taking advantage of one of the survey’s strengths, we also examined the colours of both the BCGs and satellite galaxies. While separating our sample using the median BCG colour (g_auto-r_auto = 0.8) and computing the test values, we find a strengthening in the signal for the redder subsample of 2σ for the Rao, 0.7σ for the Kuiper V, and 1.6σ for the binomial test. In addition, the non-uniformity also shows an offset of 2σ for Kuiper V and 2.5σ for binomial, reinforcing the conclusion that BCG colour is also an indicator of galaxy alignment. This decrease in signal for the bluer BCGs is consistent with previous studies (Yang et al. 2006; Huang et al. 2016), suggesting that merger events and interactions between BCGs and nearby galaxies can trigger star formation, resulting in bluer BCGs. A visual inspection of the bluer subsample reveals eight disk-like galaxies showing signs of recent interaction. These events may alter the alignment between the BCG and its satellites, which could explain the observed difference in signal.
As a final test, we divided our galaxy sample into two populations based on the colours: ‘blue’ as galaxies with g_auto-r_auto < 0.7 and ‘red’ as g_auto-r_auto > 0.7. The statistical tests reveal a difference of 1.7σ for Kuiper V and 2.6σ for the binomial test, both supported by significant non-uniformity, with deviations of 2.8σ and 3.0σ, respectively. These findings indicate that satellite colour is another key parameter influencing the strength of the alignment signal. As expected, late-type (blue) galaxies tend to be more isotropically distributed, a property that also supports their use as reliable tracers in cosmological studies (e.g. de Carvalho et al. 2021; Avila et al. 2024).
4.3. Combination of conditions
A subsequent question to our analysis is the consequences of combining the best parameters discussed above. Figure 6 presents the corresponding results. For this test, we also included the massive subsample (M > 13.5), which, although not identified as a key factor for the alignment signal, represents a highly non-uniform subsample. Interestingly, most of the combinations of parameters yield similar results for the three statistical tests, suggesting that these subsamples share intrinsic properties that contribute to a stronger alignment signal.
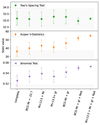 |
Fig. 6. Comparison of the best subset conditions (from left to right): (i) the complete sample, (ii) the brighter BCGs, and combinations of massive clusters and brighter BCGs (iii); massive clusters and redder BCGs (iv), brighter and redder BCGs (v), brighter and redder BCGs and red galaxies (vi), and massive clusters and brighter and redder BCGs and red galaxies (vii). The grey shaded region shows the 1σ region expected from a uniform distribution. |
To test this hypothesis, we estimated the median values of the ‘missing’ third parameter in each combination. For example, the combination M > 13.5 + BCG Mr yields a median BCG colour distribution of 0.87 ± 0.04, indicating a bias towards selecting redder BCGs. A similar trend is seen in the M > 13.5 + BCG gr subset, where the absolute magnitude distribution has a median value of −22.9 ± 0.3 – a result consistent with the median value for the complete sample – effectively favouring the selection of more luminous BCGs. Finally, the combination BCG Mr + BCG gr results in a median mass of log10M = 13.9 ± 0.3 M⊙, again above the median for the full cluster sample.
Although the discussed combinations show large error bars due to sample re-sizing, we observe a significant reduction in them after applying the colour selection to satellite galaxies. This suggests that even with fewer galaxies, the remaining sample retains those most likely to enhance the alignment statistically. The colour constraint strengthens the Mr-selected sample by 1.6σ in the Kuiper V test and 1.4σ in the binomial test. These findings imply that studies based on cluster spectroscopic samples naturally yield stronger alignment signals, as such surveys tend to prioritise bright massive galaxies (Poggianti et al. 2006; Olave-Rojas et al. 2018) – precisely those that contribute the most to the effect.
4.4. Satellite distribution
From the previous discussion, it is evident that satellite colour plays a crucial role in galaxy alignment strength. This motivated us to explore additional galaxy properties to better understand their relation with BCGs, the cluster environment, and the LSS.
Figure 7 shows the median galaxy colour as a function of distance from the cluster centre, binned up to 6 R200, for the subsample of clusters divided by the BCG colour. In a general overview, the two panels exhibit similar trends: galaxies tend to be redder closer to the cluster centre and progressively become bluer out to approximately 3 R200 (e.g. Hwang et al. 2019). Beyond this radius, the colour profile tends to flatten, which likely marks the outer limit of the environmental influence of the cluster. This interpretation is consistent with simulations showing that backsplash galaxies rarely exceed 3 R200 (Gill et al. 2005; Bahé et al. 2013). However, the behaviour is not identical across subsamples and shows a dependence on the observation direction, as discussed below.
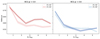 |
Fig. 7. Median values of galaxy colour as a function of cluster centre distance for the subsample divided by BCG colour. Left panel: BCG gr > 0.8. Right panel: BCG gr < 0.8. Galaxies aligned with the BCG major axis (θ < 45°) are shown as solid lines, and those aligned with the BCG minor axis (θ > 45°) as dotted lines. The shaded region indicates the median relative error. |
In the left panel, we show that galaxies aligned with the BCG major axis (θ < 45°) tend to be systematically redder than those aligned with the minor axis (θ > 45°). This trend suggests that galaxies that fall along the BCG’s major axis, which often coincides with the preferred direction of the surrounding filaments, could have experienced stronger environment preprocessing. The effect is even more evident for R > 3 R200. However, this colour offset is not apparent in the right panel, where galaxies show similar median values regardless of the observation angle, indicating a more uniform distribution among the bluer satellites. This dependence on the observation direction reinforces the hypothesis that galaxy alignment is also closely tied to accretion and LSS connectivity (Smith et al. 2023). This behaviour is consistent with previous results by Yang et al. (2006) and Rodríguez-Martín et al. (2022), who also examined satellite alignments with respect to the central galaxy orientation. In particular, Rodríguez-Martín et al. (2022) found significant anisotropies when satellites are aligned with the major axis of red central, with alignment signals extending out to ∼12 Mpc. In contrast, their results for blue central show no significant dependence on the observation angle, consistent with the result for our bluer BCG sample. Yang et al. (2006), using galaxies within the halo virial radius, also found similar alignment trends, which were stronger at smaller radii. Although these studies employ different techniques and scales, their findings reinforce our results and place them in a broader context.
When dividing the sample by BCG colour, we find that galaxies associated with redder BCGs are systematically (∼0.04 mag) redder than those around bluer BCGs across nearly all radii. This result supports the idea that the redder BCGs reside in denser environments, within or near filaments (Einasto et al. 2024), which also influence their satellite populations (galaxy conformity; e.g. Palma et al. 2025; Ayromlou et al. 2023). This is further evidenced when dividing the sample by mass: for redder BCGs, the colour difference is 0.048 ± 0.014 magnitudes within R < 3 R200; while for the bluer BCGs, this value is even stronger, averaging 0.061 ± 0.013.
Within the cluster core (0 < R < 1 R200), median colours for major- and minor-axis-aligned galaxies appear similar in the redder BCG sample. This behaviour suggests that the colour evolution becomes more uniform at smaller radii, where the cluster’s tidal and hydrodynamical effects are strongest.
At large radii (R > 3 R200), galaxies are more likely to be influenced by the LSS. If redder BCGs are typically found in denser environments, it is plausible that their surrounding filaments are also redder. These denser regions can accelerate galaxy colour evolution, either through the presence of more massive groups or via quenching processes acting directly within the filament. This scenario is consistent with the findings of Kraljic et al. (2018) and Sarron et al. (2019), who show that filaments can drive significant preprocessing. A similar interpretation could be applied to the mild decrease seen for bluer BCGs at θ < 45°, where galaxies aligned with the BCG major axis may be part of less evolved, gas-rich filaments, potentially experiencing enhanced star formation.
Additionally, BCGs, being the central galaxies of their clusters, experience numerous mergers with infalling satellites. Therefore, if filaments are predominantly feeding red galaxies into the cluster, it is not surprising that the BCGs in these environments would build up through dry mergers, resulting in redder stellar populations. In contrast, if the feeding filaments contain a larger fraction of blue galaxies, the BCGs may undergo more gas-rich (wet) mergers, leading to ongoing star formation and bluer colours.
5. Conclusions
In this study we explored the alignment between satellite galaxies and the BCG using photometric data from the S-PLUS survey. Our analysis leveraged precise photometric redshift estimates to extend alignment studies beyond spectroscopic samples, allowing for a more complete view of satellite distributions.
We examined how various parameters, including BCG properties, satellite colours, and the influence of LSSs, affect the strength of the alignment signal using a combination of multiple statistical tests (Kuiper’s V, Rao’s spacing, and binomial tests). Our results highlight the key environmental and intrinsic factors that shape galaxy orientations within clusters and their surrounding structures.
In the following, we summarise our main findings.
-
A careful selection of the photometric redshift bin enhances the alignment signal. A bin width of δz = 0.025 was found to maximise statistical significance while minimising contamination from foreground and background galaxies.
-
The BCG luminosity and colour play a crucial role in determining the strength of galaxy alignment. Brighter and redder BCGs show stronger alignment effects, suggesting a connection to the cluster’s merger history and tidal interactions, results that are in agreement with Rodriguez et al. (2022).
-
The colour distribution of satellite galaxies correlates with alignment trends. Redder satellites exhibit a more pronounced alignment with the BCG, whereas bluer galaxies show weaker correlations, in agreement with findings by Georgiou et al. (2019).
-
The combination of multiple parameters does not greatly enhance the alignment signal because the selected samples already share intrinsic properties that favour the selection of redder and brighter BCGs. However, including the restriction of using red galaxies only increases the signal by ∼1.5σ for the bright BCGs sample.
-
Galaxies aligned with the BCG major axis (θ < 45°) tend to be systematically redder than those aligned with the minor axis (θ > 45°), suggesting that galaxies might have been affected by environment preprocessing along the preferred direction.
-
Beyond 3 R200, alignment trends become influenced by large-scale filaments. Galaxies aligned with the BCG major axis exhibit more evolved colours, supporting the hypothesis that filamentary accretion plays a role in galaxy evolution.
We aim to expand this work by utilising the full fifth S-PLUS data release, which covers approximately 4600 square degrees. We will be able to conduct a more comprehensive investigation of galaxy alignments by incorporating filament-detection algorithms to study alignment trends as a function of filament connectivity and orientation, further quantifying the role of LSS. Additionally, we will examine the redshift evolution of alignment by comparing lower- and higher-redshift clusters in S-PLUS and complementary surveys. Expanding our sample will allow us to assess the impact of the cluster dynamical state and directly determine whether alignment strength differs between relaxed and merging clusters.
It is important to note that this value was derived from SDSS data and may not be fully representative for S-PLUS survey. However, given its expected small uncertainty, variations are not expected to have a significant impact on our results.
We simplify the notation of log10(M200) to M.
Acknowledgments
The S-PLUS project, including the T80-South robotic telescope and the S-PLUS scientific survey, was founded as a partnership between the Fundação de Amparo à Pesquisa do Estado de São Paulo (FAPESP), the Observatório Nacional (ON), the Federal University of Sergipe (UFS), and the Federal University of Santa Catarina (UFSC), with important financial and practical contributions from other collaborating institutes in Brazil, Chile (Universidad de La Serena), and Spain (Centro de Estudios de Física del Cosmos de Aragón, CEFCA). We further acknowledge financial support from the São Paulo Research Foundation (FAPESP) grant 2019/263492-3, the Brazilian National Research Council (CNPq), the Coordination for the Improvement of Higher Education Personnel (CAPES), the Carlos Chagas Filho Rio de Janeiro State Research Foundation (FAPERJ), and the Brazilian Innovation Agency (FINEP). The members of the S-PLUS collaboration are grateful for the contributions from CTIO staff in helping in the construction, commissioning and maintenance of the T80-South telescope and camera. We are also indebted to Rene Laporte, INPE, and Keith Taylor for their important contributions to the project. From CEFCA, we thank Antonio Marín-Franch for his invaluable contributions in the early phases of the project, David Cristóbal-Hornillos and his team for their help with the installation of the data reduction package jype version 0.9.9, César Íñiguez for providing 2D measurements of the filter transmissions, and all other staff members for their support with various aspects of the project. L.D. acknowledges the support from the funding agency FAPESP (grant #2024/03575-9). RS acknowledges financial support from FONDECYT Regular 2023 project No. 1230441 and also gratefully acknowledges financial support from ANID – MILENIO NCN2024_112. F.R.H. acknowledges support from FAPESP grants 2018/21661-9 and 2021/11345-5. L.N. acknowledges FAPESP (grant number 2024/07281-0). T.S.G. would like to thank the support of CNPq (grant 314449/2023-0). We would like to thank the helpful participation of the S-PLUS collaboration, in particular, A.A., A.L., C.L., C.L.D., D.P.A., G.L., H.K., R.H., J.N.C., P.A.L., P.K.H., R.D., Y.J.T.
References
- Argyres, P. C., Groth, E. J., Peebles, P. J. E., & Struble, M. F. 1986, AJ, 91, 471 [Google Scholar]
- Avila, F., de Carvalho, E., Bernui, A., Lima, H., & Nunes, R. C. 2024, MNRAS, 529, 4980 [Google Scholar]
- Ayromlou, M., Kauffmann, G., Anand, A., & White, S. D. M. 2023, MNRAS, 519, 1913 [Google Scholar]
- Bahé, Y. M., McCarthy, I. G., Balogh, M. L., & Font, A. S. 2013, MNRAS, 430, 3017 [Google Scholar]
- Bertin, E., & Arnouts, S. 1996, A&AS, 117, 393 [NASA ADS] [CrossRef] [EDP Sciences] [Google Scholar]
- Blanton, M. R., & Roweis, S. 2007, AJ, 133, 734 [NASA ADS] [CrossRef] [Google Scholar]
- Chen, Y.-C., Ho, S., Blazek, J., et al. 2019, MNRAS, 485, 2492 [NASA ADS] [CrossRef] [Google Scholar]
- Colless, M., Dalton, G., Maddox, S., et al. 2001, MNRAS, 328, 1039 [Google Scholar]
- de Carvalho, E., Bernui, A., Avila, F., Novaes, C. P., & Nogueira-Cavalcante, J. P. 2021, A&A, 649, A20 [NASA ADS] [CrossRef] [EDP Sciences] [Google Scholar]
- de Lima, E. V. R. 2024, https://doi.org/10.5281/zenodo.12728524 [Google Scholar]
- Doubrawa, L., Cypriano, E. S., Finoguenov, A., et al. 2024, A&A, 685, A98 [NASA ADS] [CrossRef] [EDP Sciences] [Google Scholar]
- Einasto, M., Einasto, J., Tenjes, P., et al. 2024, A&A, 681, A91 [NASA ADS] [CrossRef] [EDP Sciences] [Google Scholar]
- Fuller, T. M., West, M. J., & Bridges, T. J. 1999, ApJ, 519, 22 [Google Scholar]
- Georgiou, C., Johnston, H., Hoekstra, H., et al. 2019, A&A, 622, A90 [NASA ADS] [CrossRef] [EDP Sciences] [Google Scholar]
- Gill, S. P. D., Knebe, A., & Gibson, B. K. 2005, MNRAS, 356, 1327 [CrossRef] [Google Scholar]
- Gonzalez, A. 2014, Building the Euclid Cluster Survey – Scientific Program, 7 [Google Scholar]
- Herpich, F. R., Almeida-Fernandes, F., Oliveira Schwarz, G. B., et al. 2024, A&A, 689, A249 [NASA ADS] [CrossRef] [EDP Sciences] [Google Scholar]
- Huang, H.-J., Mandelbaum, R., Freeman, P. E., et al. 2016, MNRAS, 463, 222 [Google Scholar]
- Huang, H.-J., Mandelbaum, R., Freeman, P. E., et al. 2018, MNRAS, 474, 4772 [NASA ADS] [CrossRef] [Google Scholar]
- Hwang, H. S., Shin, J., & Song, H. 2019, MNRAS, 489, 339 [NASA ADS] [CrossRef] [Google Scholar]
- Joachimi, B., Cacciato, M., Kitching, T. D., et al. 2015, Space Sci. Rev., 193, 1 [Google Scholar]
- Jõeveer, M., Einasto, J., & Tago, E. 1978, MNRAS, 185, 357 [Google Scholar]
- Kraljic, K., Arnouts, S., Pichon, C., et al. 2018, MNRAS, 474, 547 [Google Scholar]
- Kuiper, N. H. 1960, Indagationes Mathematicae (Proceedings), 63, 38 [Google Scholar]
- Lambas, D. G., Groth, E. J., & Peebles, P. J. E. 1988, AJ, 95, 996 [Google Scholar]
- Lim, S. H., Mo, H. J., Lu, Y., Wang, H., & Yang, X. 2017, MNRAS, 470, 2982 [NASA ADS] [CrossRef] [Google Scholar]
- Lima, E. V. R., Sodré, L., Bom, C. R., et al. 2022, Astron. Comput., 38, 100510 [NASA ADS] [CrossRef] [Google Scholar]
- Maturi, M., Finoguenov, A., Lopes, P. A. A., et al. 2023, A&A, 678, A145 [NASA ADS] [CrossRef] [EDP Sciences] [Google Scholar]
- Mendes de Oliveira, C., Ribeiro, T., Schoenell, W., et al. 2019, MNRAS, 489, 241 [NASA ADS] [CrossRef] [Google Scholar]
- Nakazono, L., Mendes de Oliveira, C., Hirata, N. S. T., et al. 2021, MNRAS, 507, 5847 [CrossRef] [Google Scholar]
- Nelson, D., Springel, V., Pillepich, A., et al. 2019, Comput. Astrophys. Cosmol., 6, 2 [Google Scholar]
- Niederste-Ostholt, M., Strauss, M. A., Dong, F., Koester, B. P., & McKay, T. A. 2010, MNRAS, 405, 2023 [NASA ADS] [Google Scholar]
- Olave-Rojas, D., Cerulo, P., Demarco, R., et al. 2018, MNRAS, 479, 2328 [Google Scholar]
- O’Mill, A. L., Duplancic, F., García Lambas, D., & Sodré, L. 2011, MNRAS, 413, 1395 [Google Scholar]
- Palma, D., Lacerna, I., Artale, M. C., et al. 2025, A&A, 693, A67 [NASA ADS] [CrossRef] [EDP Sciences] [Google Scholar]
- Planck Collaboration XIII. 2016, A&A, 594, A13 [NASA ADS] [CrossRef] [EDP Sciences] [Google Scholar]
- Poggianti, B. M., von der Linden, A., De Lucia, G., et al. 2006, ApJ, 642, 188 [NASA ADS] [CrossRef] [Google Scholar]
- Ragone-Figueroa, C., Granato, G. L., Borgani, S., et al. 2020, MNRAS, 495, 2436 [Google Scholar]
- Rao, J. S. 1976, Sankhyā: The Indian Journal of Statistics, Series B (1960–2002), 38, 329 [Google Scholar]
- Rodriguez, F., Merchán, M., & Artale, M. C. 2022, MNRAS, 514, 1077 [NASA ADS] [CrossRef] [Google Scholar]
- Rodriguez, F., Merchán, M., & Artale, M. C. 2024, A&A, 688, A40 [NASA ADS] [CrossRef] [EDP Sciences] [Google Scholar]
- Rodriguez, F., Merchán, M., Galárraga-Espinosa, D., et al. 2025, A&A, 699, A215 [NASA ADS] [CrossRef] [EDP Sciences] [Google Scholar]
- Rodríguez-Martín, J. E., González Delgado, R. M., Martínez-Solaeche, G., et al. 2022, A&A, 666, A160 [NASA ADS] [CrossRef] [EDP Sciences] [Google Scholar]
- Sarron, F., Adami, C., Durret, F., & Laigle, C. 2019, A&A, 632, A49 [NASA ADS] [CrossRef] [EDP Sciences] [Google Scholar]
- Sastry, G. N. 1968, PASP, 80, 252 [CrossRef] [Google Scholar]
- Sifón, C., Hoekstra, H., Cacciato, M., et al. 2015, A&A, 575, A48 [NASA ADS] [CrossRef] [EDP Sciences] [Google Scholar]
- Smith, R., Hwang, H. S., Kraljic, K., et al. 2023, MNRAS, 525, 4685 [NASA ADS] [CrossRef] [Google Scholar]
- Wen, Z. L., Han, J. L., & Liu, F. S. 2012, ApJS, 199, 34 [Google Scholar]
- Werner, S. V., Cypriano, E. S., Gonzalez, A. H., et al. 2022, MNRAS, 519, 2630 [CrossRef] [Google Scholar]
- West, M. J. 1994, MNRAS, 268, 79 [Google Scholar]
- West, M. J., de Propris, R., Bremer, M. N., & Phillipps, S. 2017, Nat. Astron., 1, 0157 [Google Scholar]
- White, S. D. M., & Frenk, C. S. 1991, ApJ, 379, 52 [Google Scholar]
- Wittman, D., Foote, D., & Golovich, N. 2019, ApJ, 874, 84 [Google Scholar]
- Yang, X., Van Den Bosch, F. C., Mo, H. J., et al. 2006, MNRAS, 369, 1293 [NASA ADS] [CrossRef] [Google Scholar]
All Figures
|
Fig. 1. Illustration of the angular distance (θ) between the BCG orientation and the n-th galaxy’s sky position. In this example, the BCG coincides with the cluster centre, although this is not always the case. |
| In the text | |
|
Fig. 2. Mean and standard deviation of the statistical values from the Kuiper V, binomial, and Rao tests, obtained from simulations of uniformly distributed particles. The solid and dashed lines represent interpolated values for the expected results. |
| In the text | |
|
Fig. 3. Results of non-uniformity tests for different photometric redshift widths (Δz), used to determine the optimal selection aperture. Rao’s spacing test (green), Kuiper’s V test (orange), and the binomial test (purple) are shown. |
| In the text | |
|
Fig. 4. Left panel: Statistical test values for different subsets, normalised using bootstrapping to allow direct comparison. The grey shaded region shows the 1σ region expected from a uniform distribution. Right panel: Statistical significance of the results compared to uniform simulations. The subsets include the complete sample, BCG ellipticity thresholds (ell > 0.1, 0.2, 0.3), BCG median distance from the cluster centre (R), BCG absolute magnitude relative to the complete sample median in the r band (BCG Mr), BCG colours g_auto-r_auto relative to the median (BCG gr), and the satellite galaxy colour (blue or red gal). The dotted black line indicates the 1σ region. |
| In the text | |
|
Fig. 5. Comparison between the median values from Fig. 4 and the expected uniform distribution from simulations. The values indicate how many sigma the distribution deviates from uniformity. The dotted black line indicates the 1σ region. |
| In the text | |
|
Fig. 6. Comparison of the best subset conditions (from left to right): (i) the complete sample, (ii) the brighter BCGs, and combinations of massive clusters and brighter BCGs (iii); massive clusters and redder BCGs (iv), brighter and redder BCGs (v), brighter and redder BCGs and red galaxies (vi), and massive clusters and brighter and redder BCGs and red galaxies (vii). The grey shaded region shows the 1σ region expected from a uniform distribution. |
| In the text | |
|
Fig. 7. Median values of galaxy colour as a function of cluster centre distance for the subsample divided by BCG colour. Left panel: BCG gr > 0.8. Right panel: BCG gr < 0.8. Galaxies aligned with the BCG major axis (θ < 45°) are shown as solid lines, and those aligned with the BCG minor axis (θ > 45°) as dotted lines. The shaded region indicates the median relative error. |
| In the text | |
Current usage metrics show cumulative count of Article Views (full-text article views including HTML views, PDF and ePub downloads, according to the available data) and Abstracts Views on Vision4Press platform.
Data correspond to usage on the plateform after 2015. The current usage metrics is available 48-96 hours after online publication and is updated daily on week days.
Initial download of the metrics may take a while.