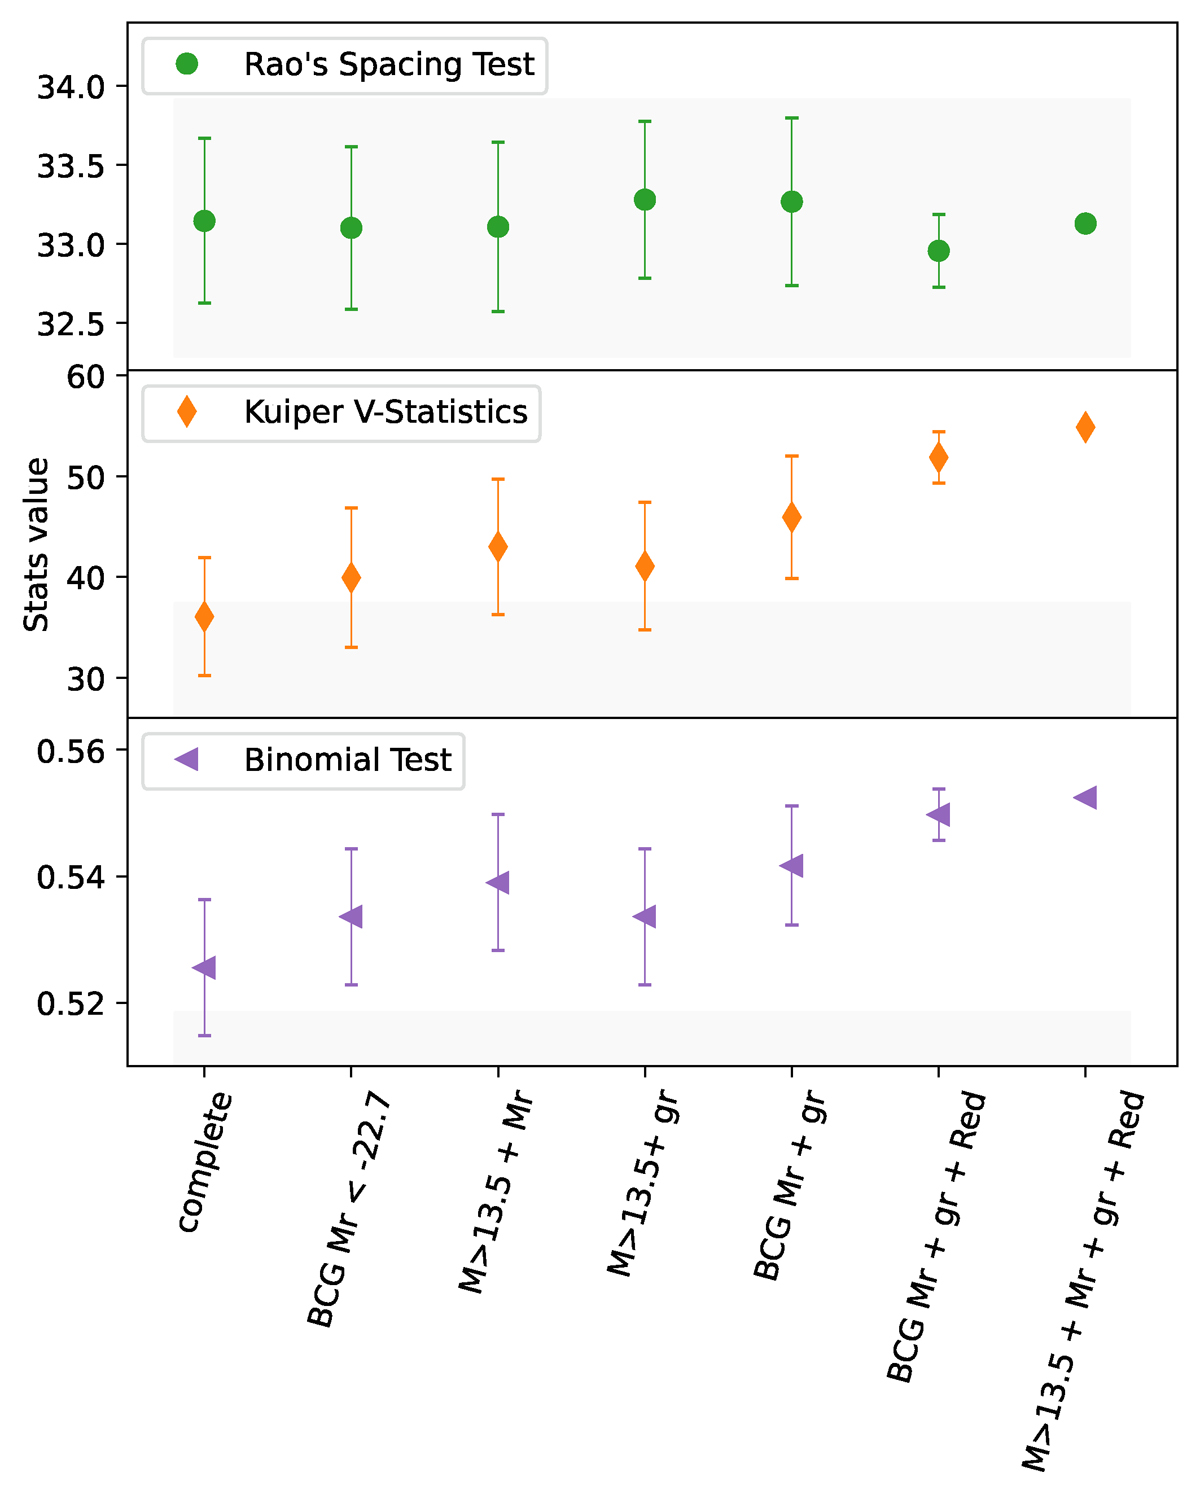
Fig. 6.
Download original image
Comparison of the best subset conditions (from left to right): (i) the complete sample, (ii) the brighter BCGs, and combinations of massive clusters and brighter BCGs (iii); massive clusters and redder BCGs (iv), brighter and redder BCGs (v), brighter and redder BCGs and red galaxies (vi), and massive clusters and brighter and redder BCGs and red galaxies (vii). The grey shaded region shows the 1σ region expected from a uniform distribution.
Current usage metrics show cumulative count of Article Views (full-text article views including HTML views, PDF and ePub downloads, according to the available data) and Abstracts Views on Vision4Press platform.
Data correspond to usage on the plateform after 2015. The current usage metrics is available 48-96 hours after online publication and is updated daily on week days.
Initial download of the metrics may take a while.