Fig. 7.
Download original image
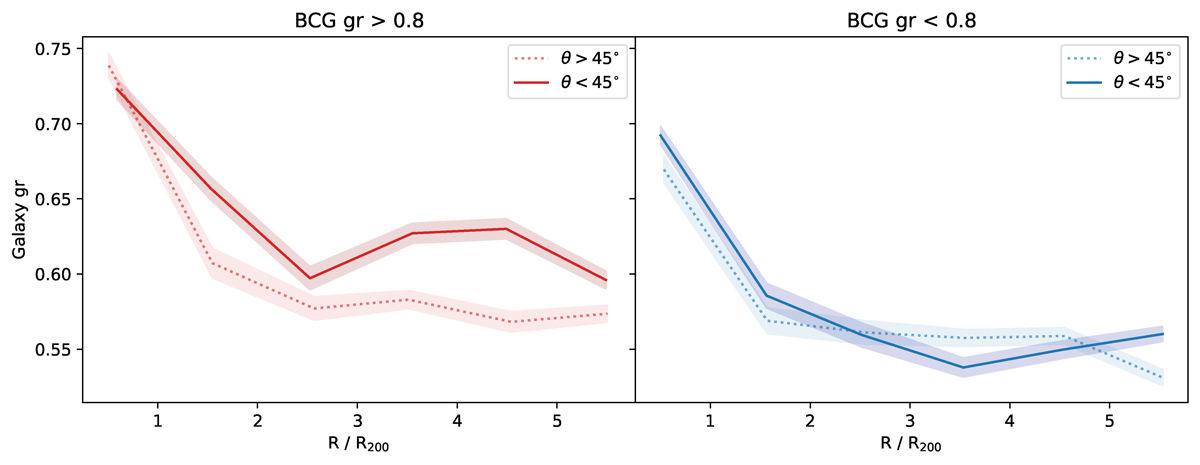
Median values of galaxy colour as a function of cluster centre distance for the subsample divided by BCG colour. Left panel: BCG gr > 0.8. Right panel: BCG gr < 0.8. Galaxies aligned with the BCG major axis (θ < 45°) are shown as solid lines, and those aligned with the BCG minor axis (θ > 45°) as dotted lines. The shaded region indicates the median relative error.
Current usage metrics show cumulative count of Article Views (full-text article views including HTML views, PDF and ePub downloads, according to the available data) and Abstracts Views on Vision4Press platform.
Data correspond to usage on the plateform after 2015. The current usage metrics is available 48-96 hours after online publication and is updated daily on week days.
Initial download of the metrics may take a while.