Fig. 1
Download original image
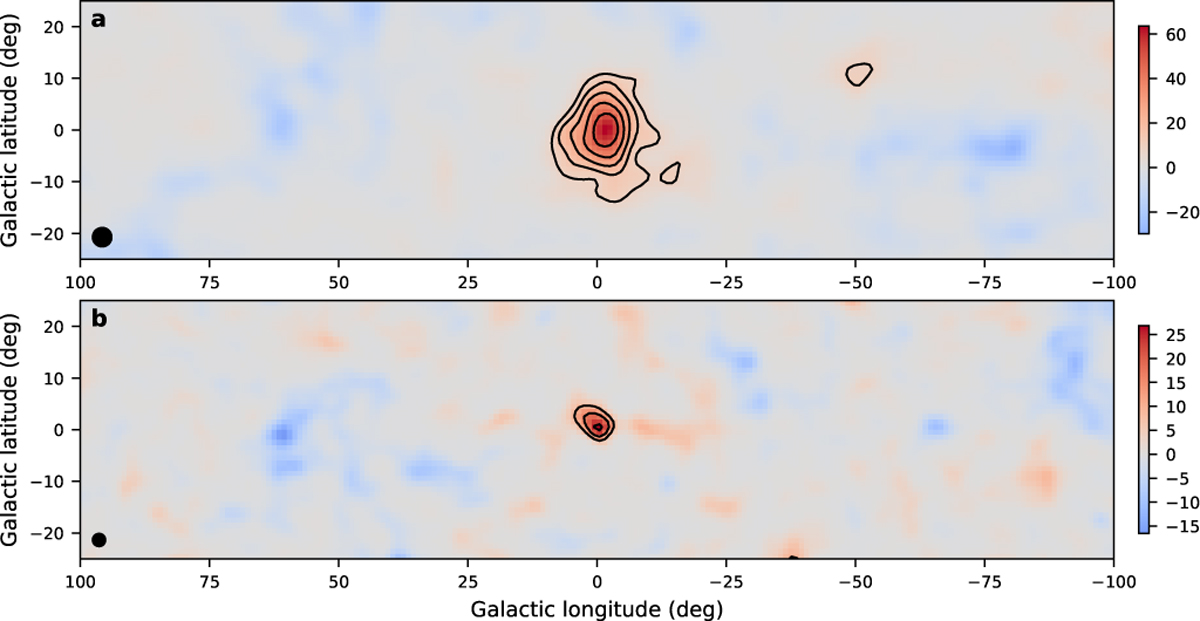
Test statistic (TS) maps in the 0.75–3 MeV (a) and 3–30 MeV (b) energy bands. The significance, expressed in Gaussian sigma, corresponds to ![]() , where negative TS values correspond to model fits that resulted in negative source flux. The contours indicate the pre-trial detection significance in Gaussian sigma, with contours spaced by 1σ and the first contour starting at 3σ. The filled circles in the lower-left corners of the maps indicate the 68% containment region of the COMPTEL point spread function.
, where negative TS values correspond to model fits that resulted in negative source flux. The contours indicate the pre-trial detection significance in Gaussian sigma, with contours spaced by 1σ and the first contour starting at 3σ. The filled circles in the lower-left corners of the maps indicate the 68% containment region of the COMPTEL point spread function.
Current usage metrics show cumulative count of Article Views (full-text article views including HTML views, PDF and ePub downloads, according to the available data) and Abstracts Views on Vision4Press platform.
Data correspond to usage on the plateform after 2015. The current usage metrics is available 48-96 hours after online publication and is updated daily on week days.
Initial download of the metrics may take a while.