Fig. 3
Download original image
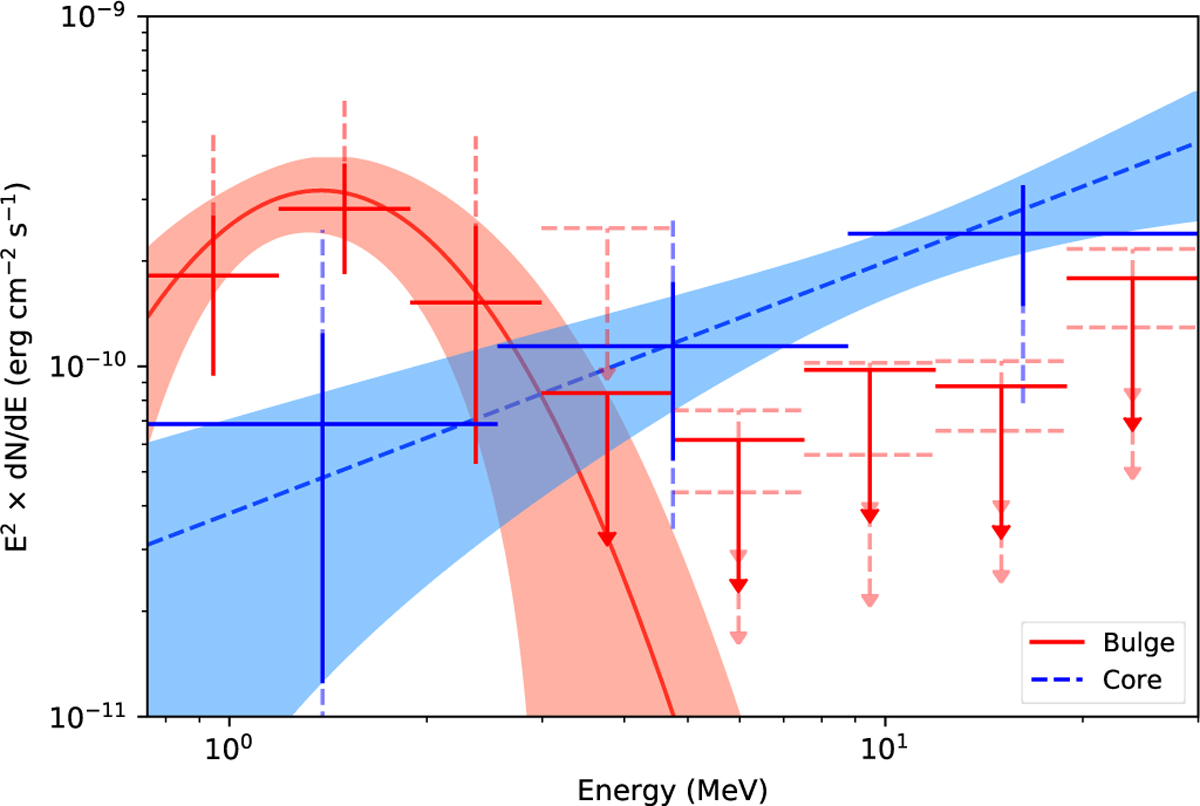
Spectral energy distributions and fitted spectral laws for the Bulge and Core components. Systematic uncertainties related to different modelling of the Galactic ridge emission are shown as light dashed vertical bars. For upper limits, we show the smallest and largest values obtained under variation of the Galactic ridge emission model as faint dashed arrows.
Current usage metrics show cumulative count of Article Views (full-text article views including HTML views, PDF and ePub downloads, according to the available data) and Abstracts Views on Vision4Press platform.
Data correspond to usage on the plateform after 2015. The current usage metrics is available 48-96 hours after online publication and is updated daily on week days.
Initial download of the metrics may take a while.